GEOGLOWS Demo
This tutorial walks through building a TethysDash dashboard that displays the GEOGLOWS Global Water Model river flowlines for China, with a user-selectable base map. By the end you will have a working dashboard equivalent to GEOGLOWS_China_TethysDash.json.
Finished product: https://demo.tethysgeoscience.org/apps/tethysdash/dashboard/fe72fe22-eb5e-4795-9c13-cacee79e1b0d
What you will build
A Map visualization that loads the GEOGLOWS Global Water Model
MapServerand filters it to Chinese rivers.Configured attribute aliases and a clean popup showing only the most useful fields.
A Base Map variable input so the user can switch the underlying base map at runtime without editing the dashboard.
Prerequisites
Before starting you should be comfortable with:
The TethysDash landing page (see Landing Page)
Creating and editing dashboard items (see Editing Dashboards)
Variable inputs (see Variable Inputs)
Maps (see Maps)
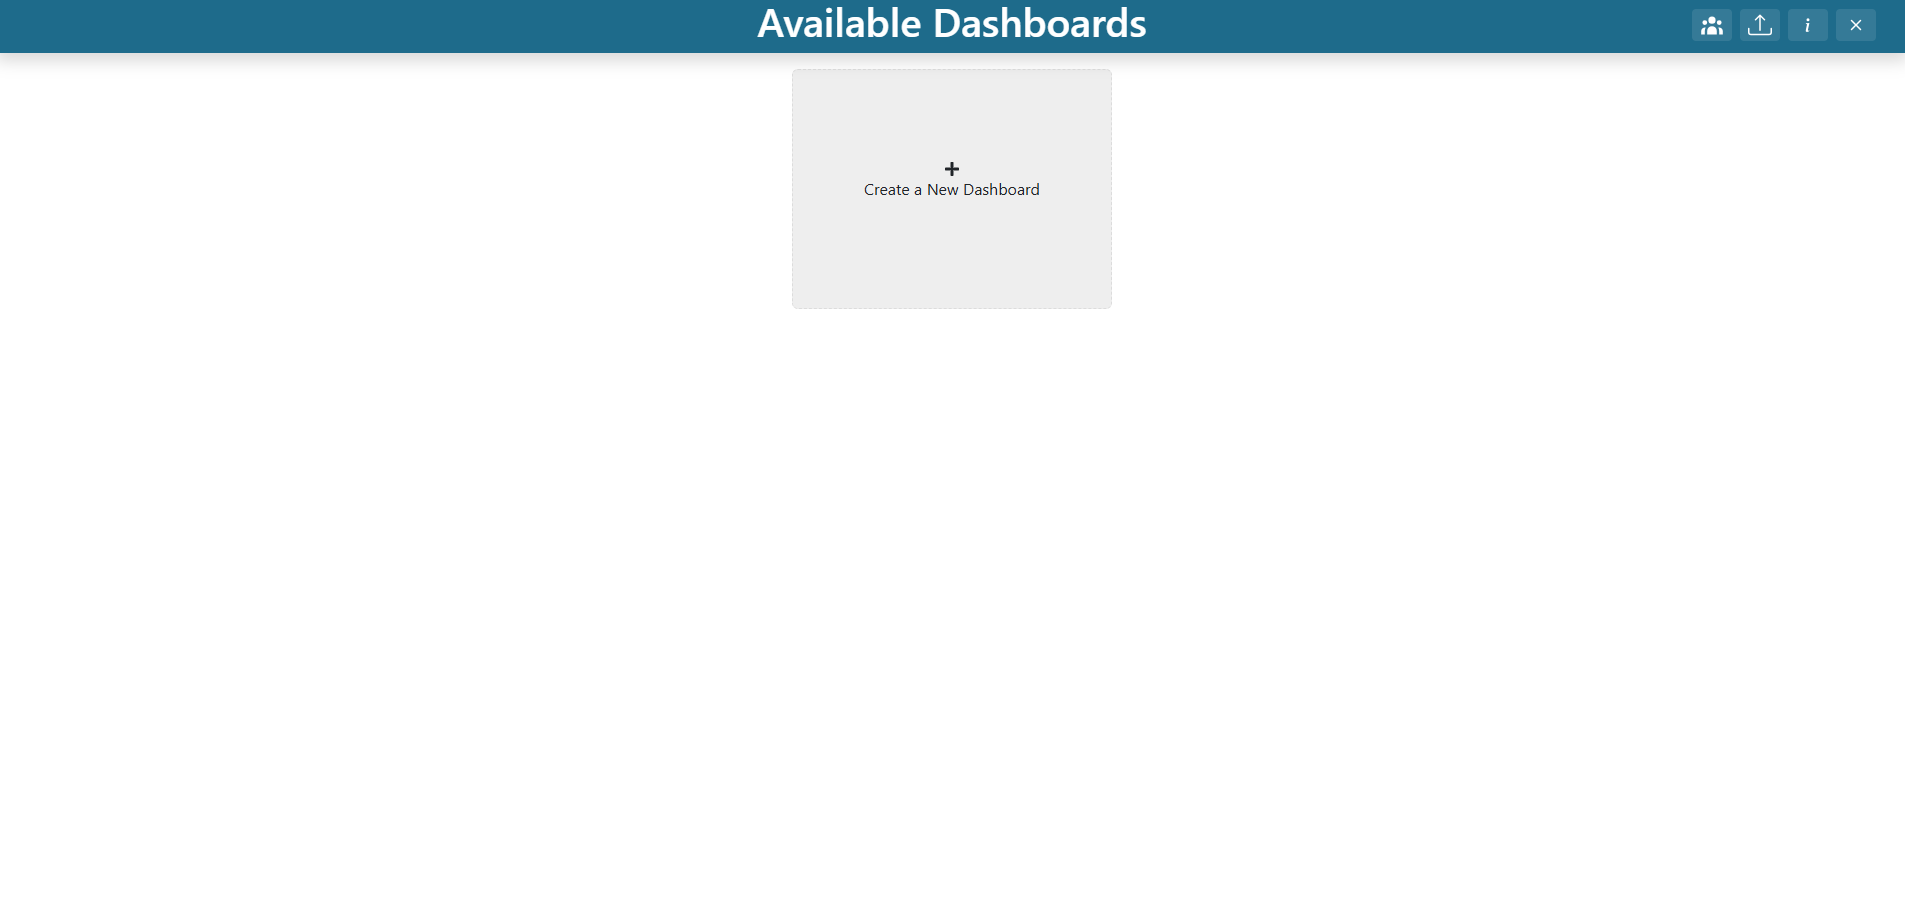
Step 1 — Create the dashboard
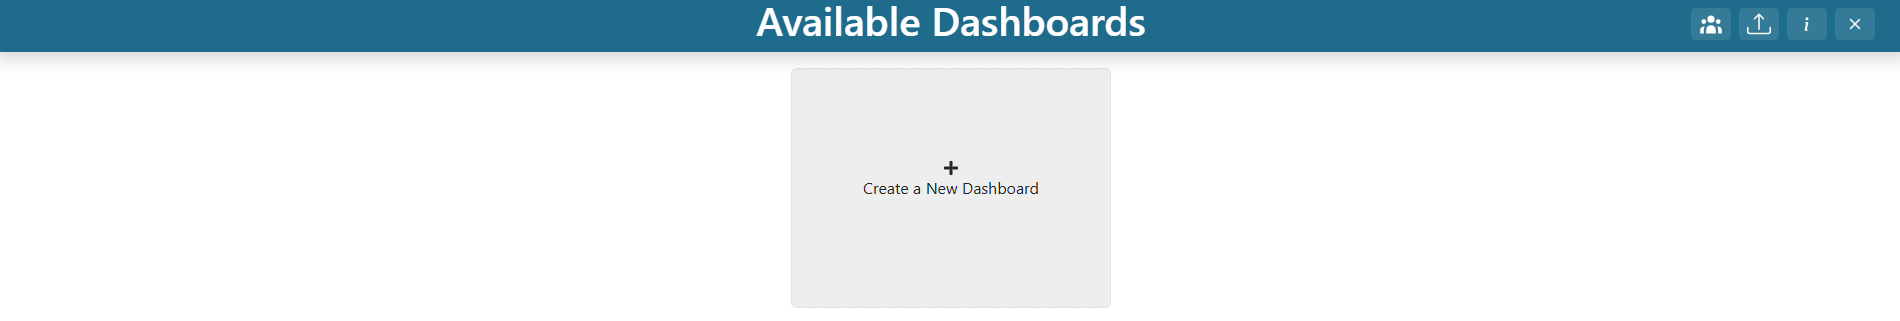
From the TethysDash landing page, click + Create a New Dashboard.
Enter the following:
Name:
GEOGLOWS DemoDescription:
demo
Click Create.
Double-click the new
GEOGLOWS Demodashboard card to open it.
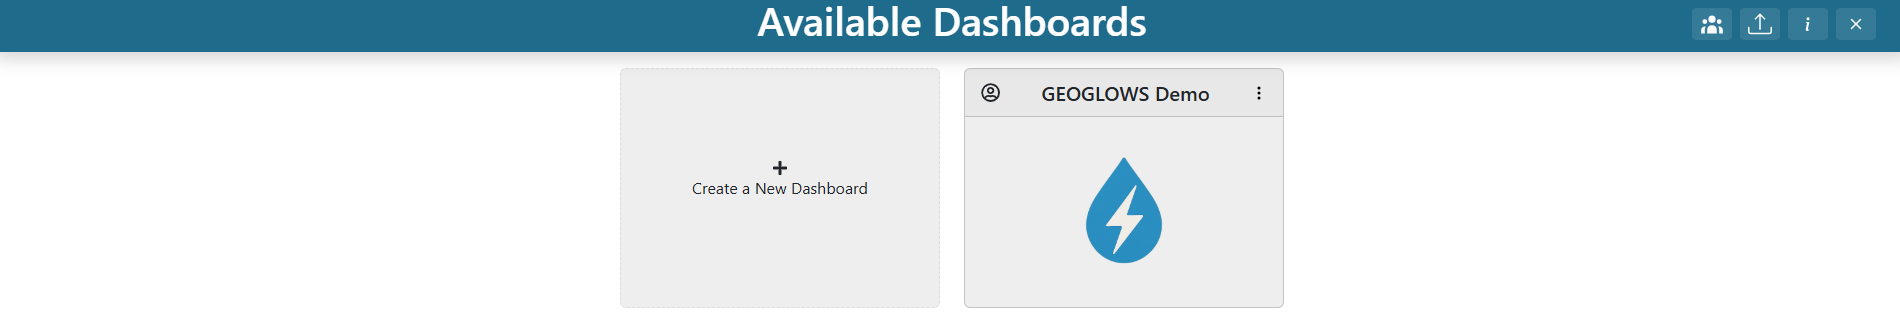
You should now be looking at a fresh dashboard containing one default grid item. If the TethysDash Dashboards modal appears, dismiss it by checking the “Don’t show on startup” option and then pressing the “X” button. You may reopen the modal in the future by pressing the i button in the app header.
Step 2 — Edit the existing grid item to be a Map
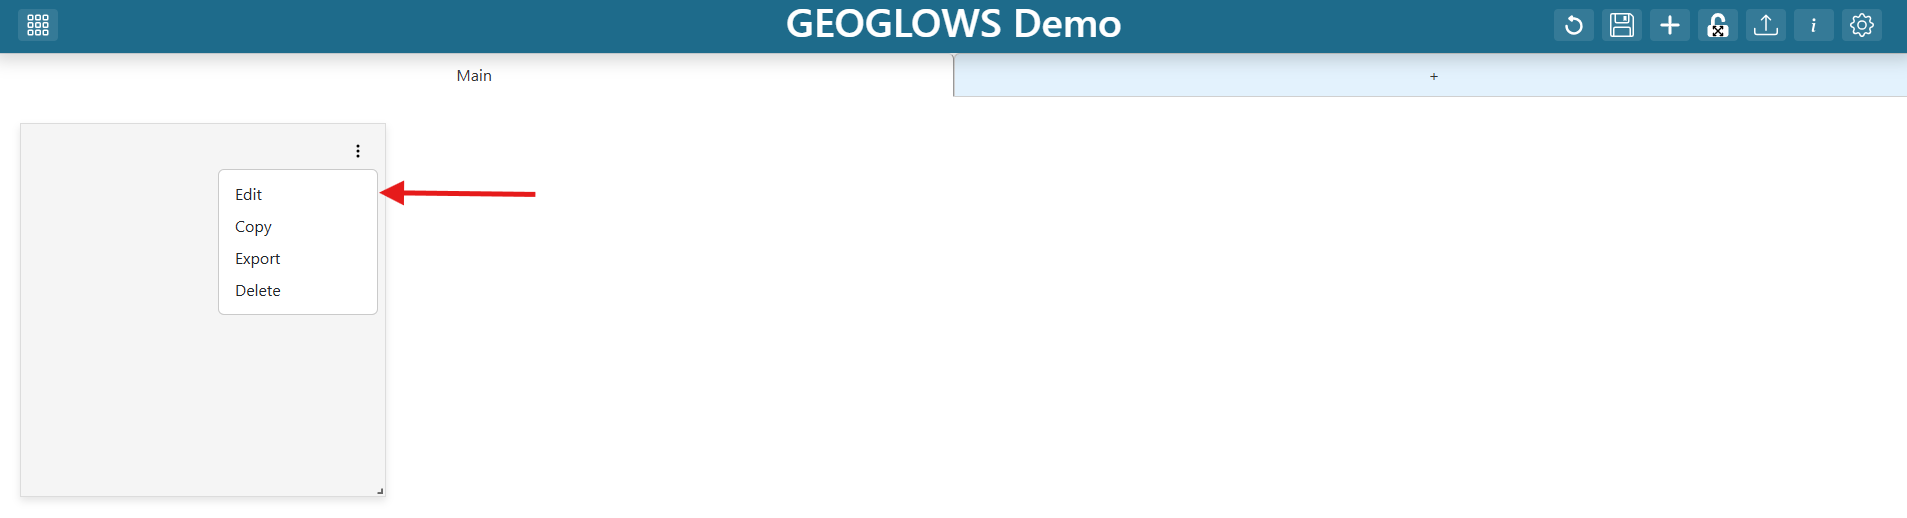
Toggle the dashboard into edit mode by clicking the pencil / Edit icon in the toolbar.
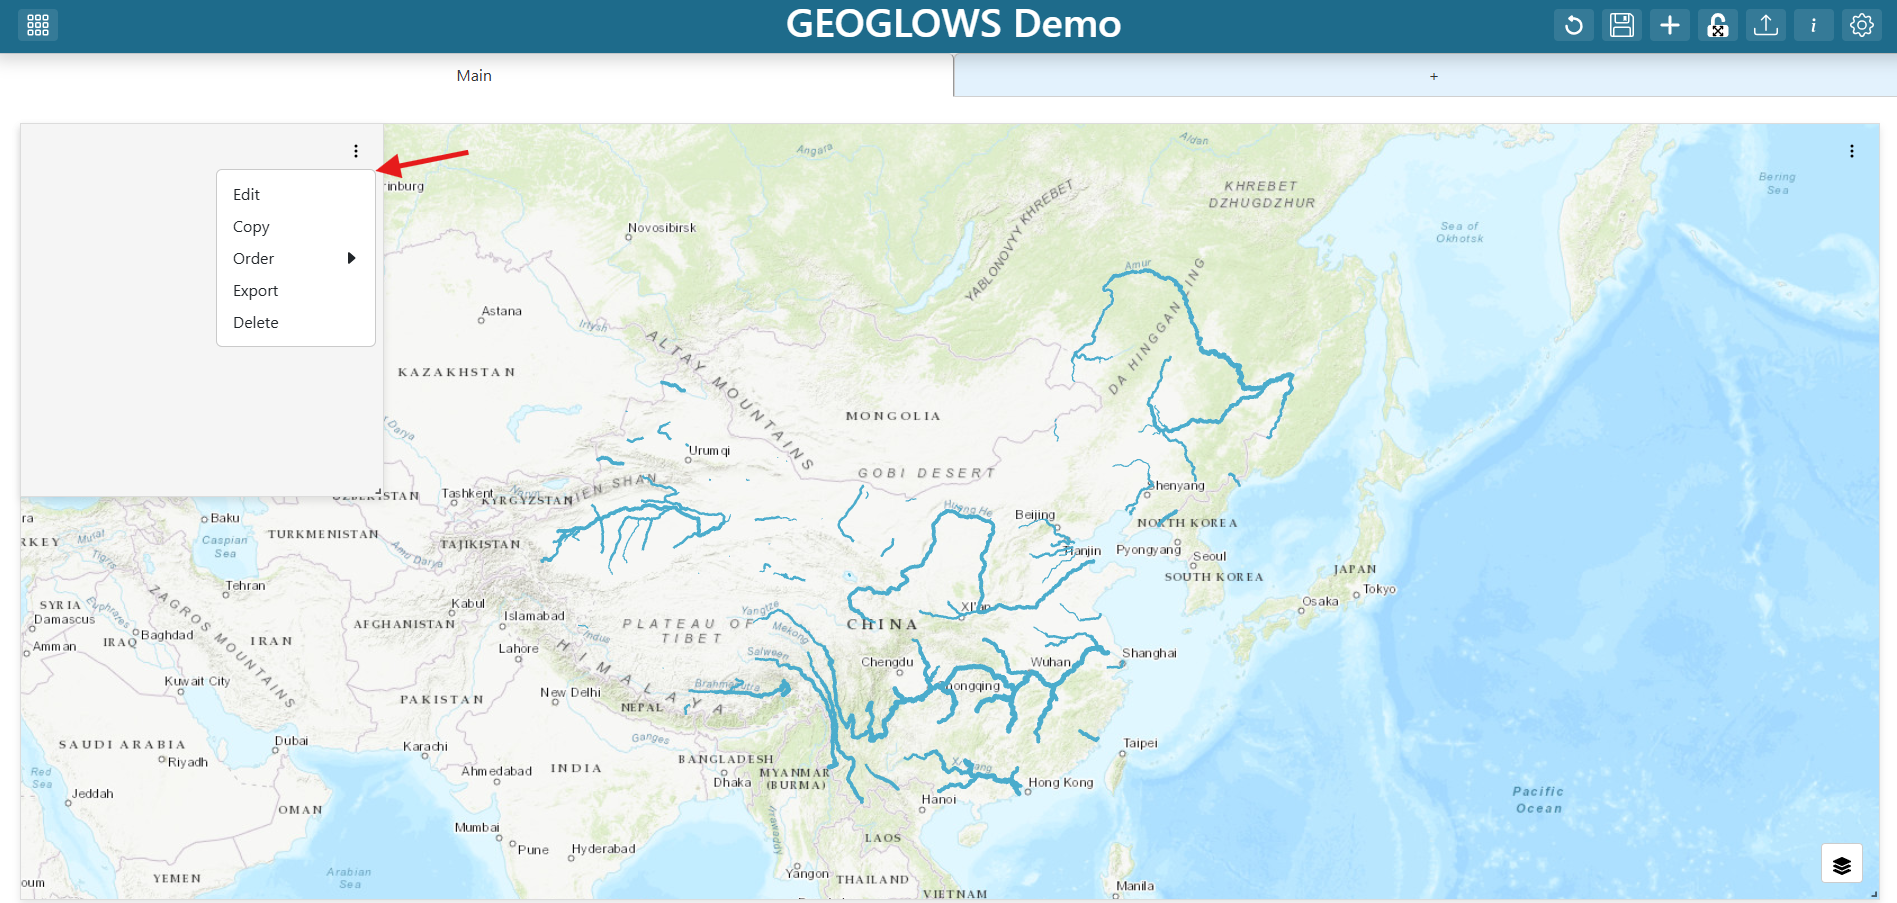
Find the default grid item and click its three-dot menu.
Click Edit.
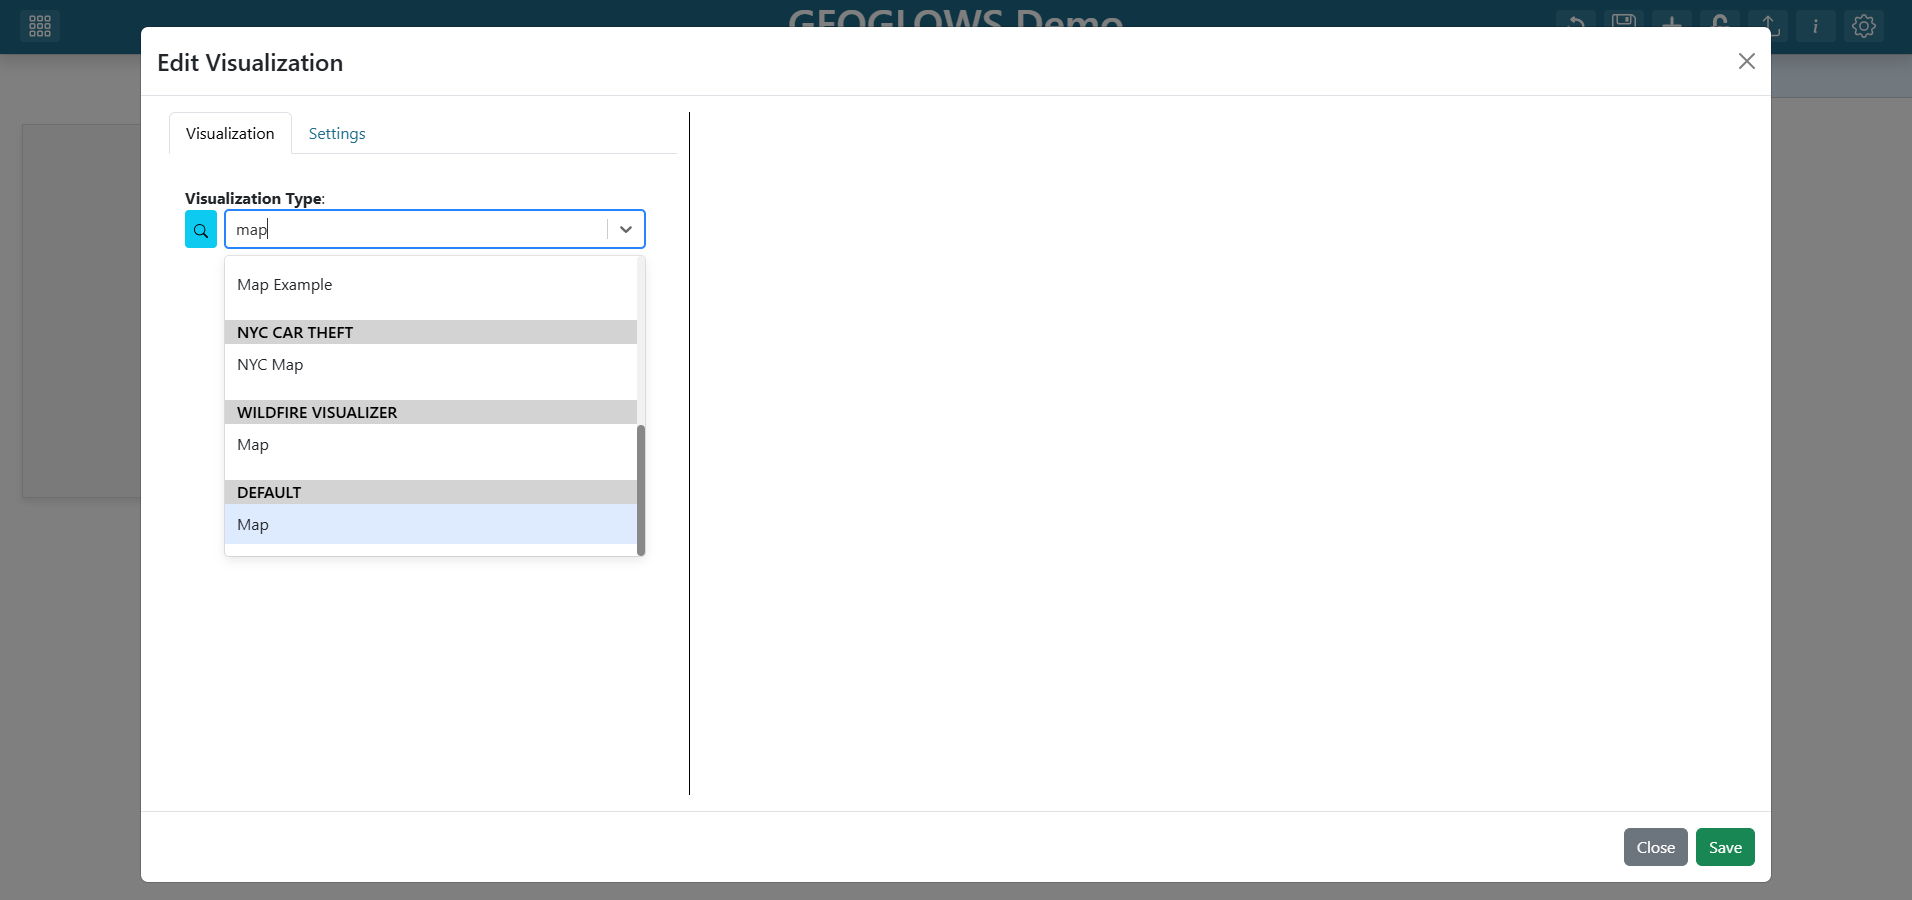
In the Visualization Type dropdown, type
Mapand select the Map option under the Default section.
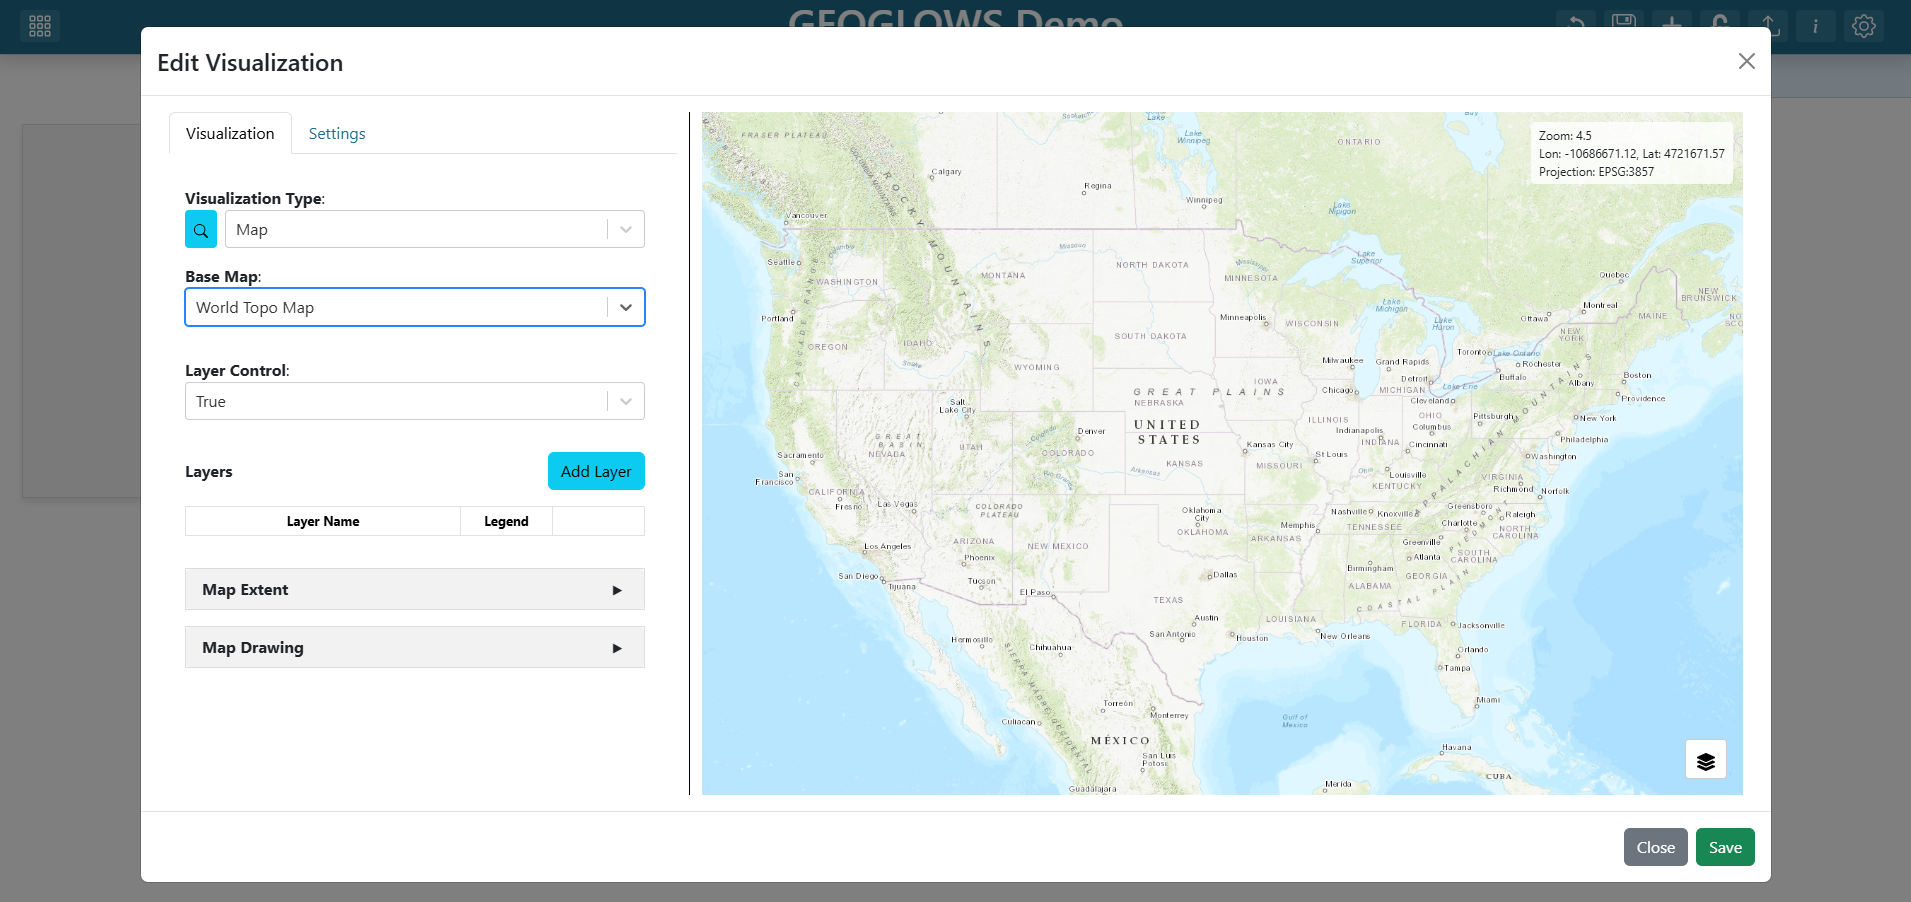
Select a Base Map for the map (for example,
World Topo Map).
Note
See Create a Map for the full Map editor reference.
Step 3 — Add the map layer
Click Add Layer.
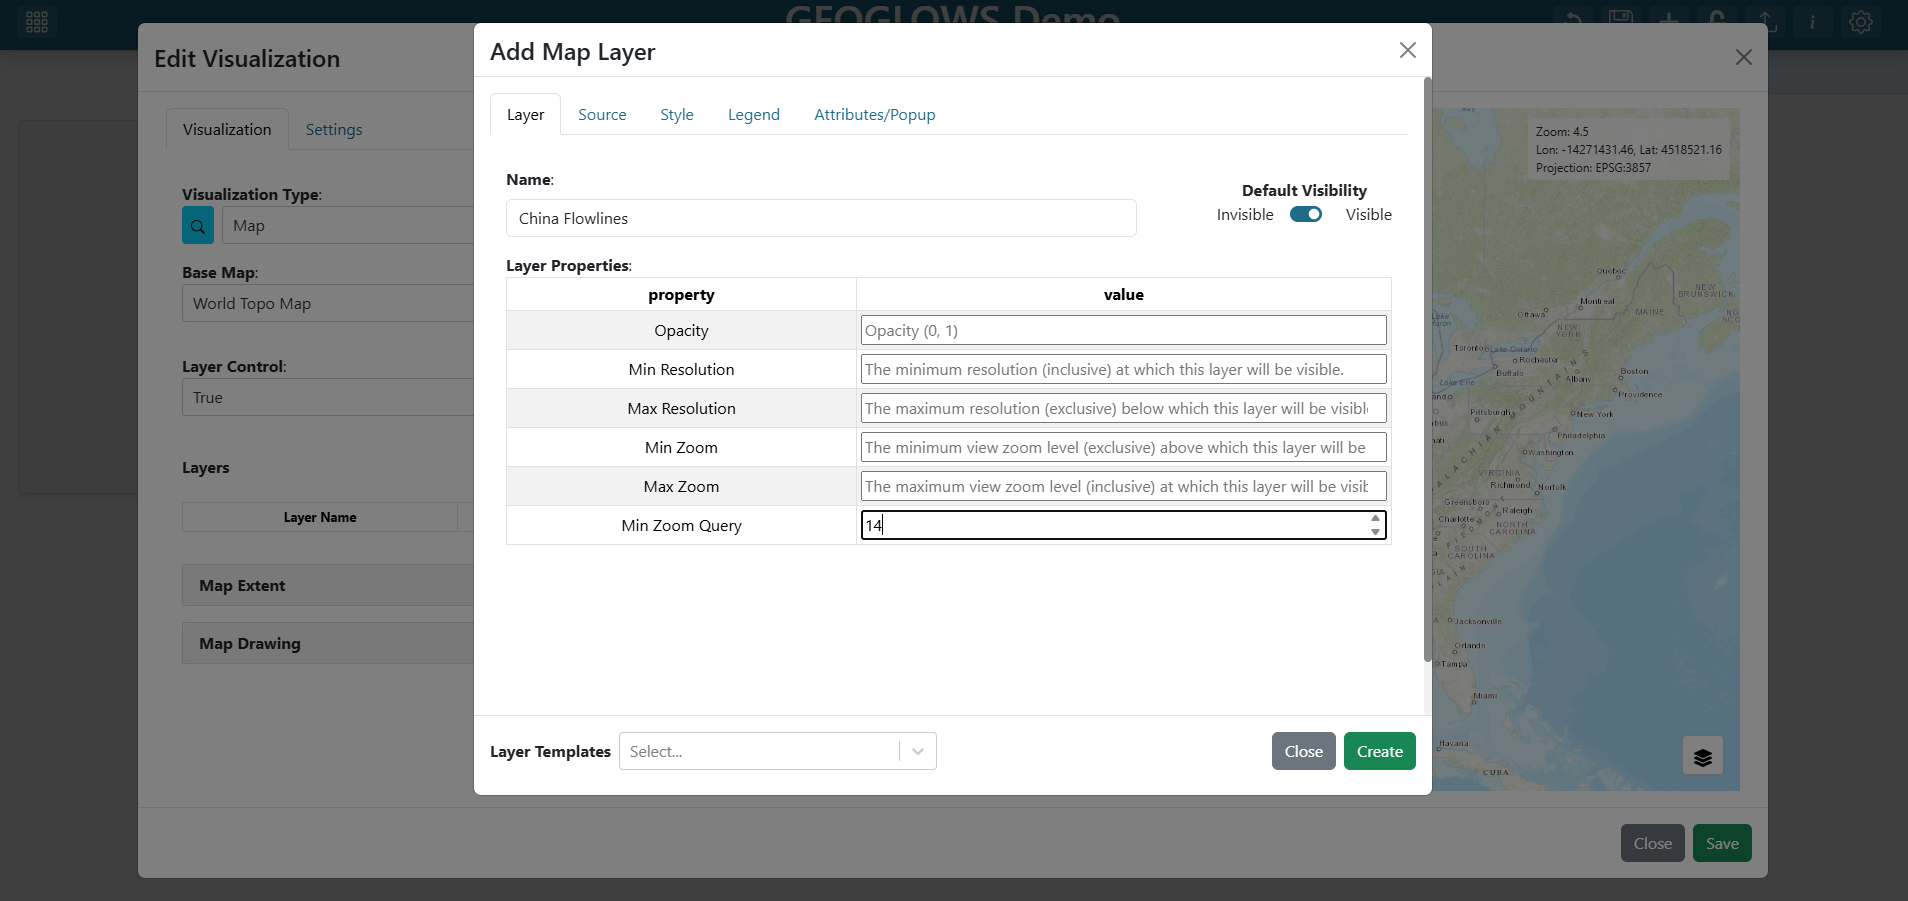
Configure the new layer as follows:
Name:
China FlowlinesMin Zoom Query:
12
Note
Why Min Zoom Query? The GEOGLOWS service has hundreds of thousands of features. Setting a min zoom of 12 means popup queries (which fetch attributes for clicked features) only fire once the user has zoomed in far enough that the request is small and fast.
See the Layer Tab for all layer-level options.
Tip
Thin flowlines are hard to click exactly. To make them easier to select, also set Click Tolerance to 20 and check Snap To Features — hovering near a river then highlights the nearest reach with a snapped marker, and a click selects it without precise aim. See Feature Snapping and Click Tolerance for how snapping behaves.
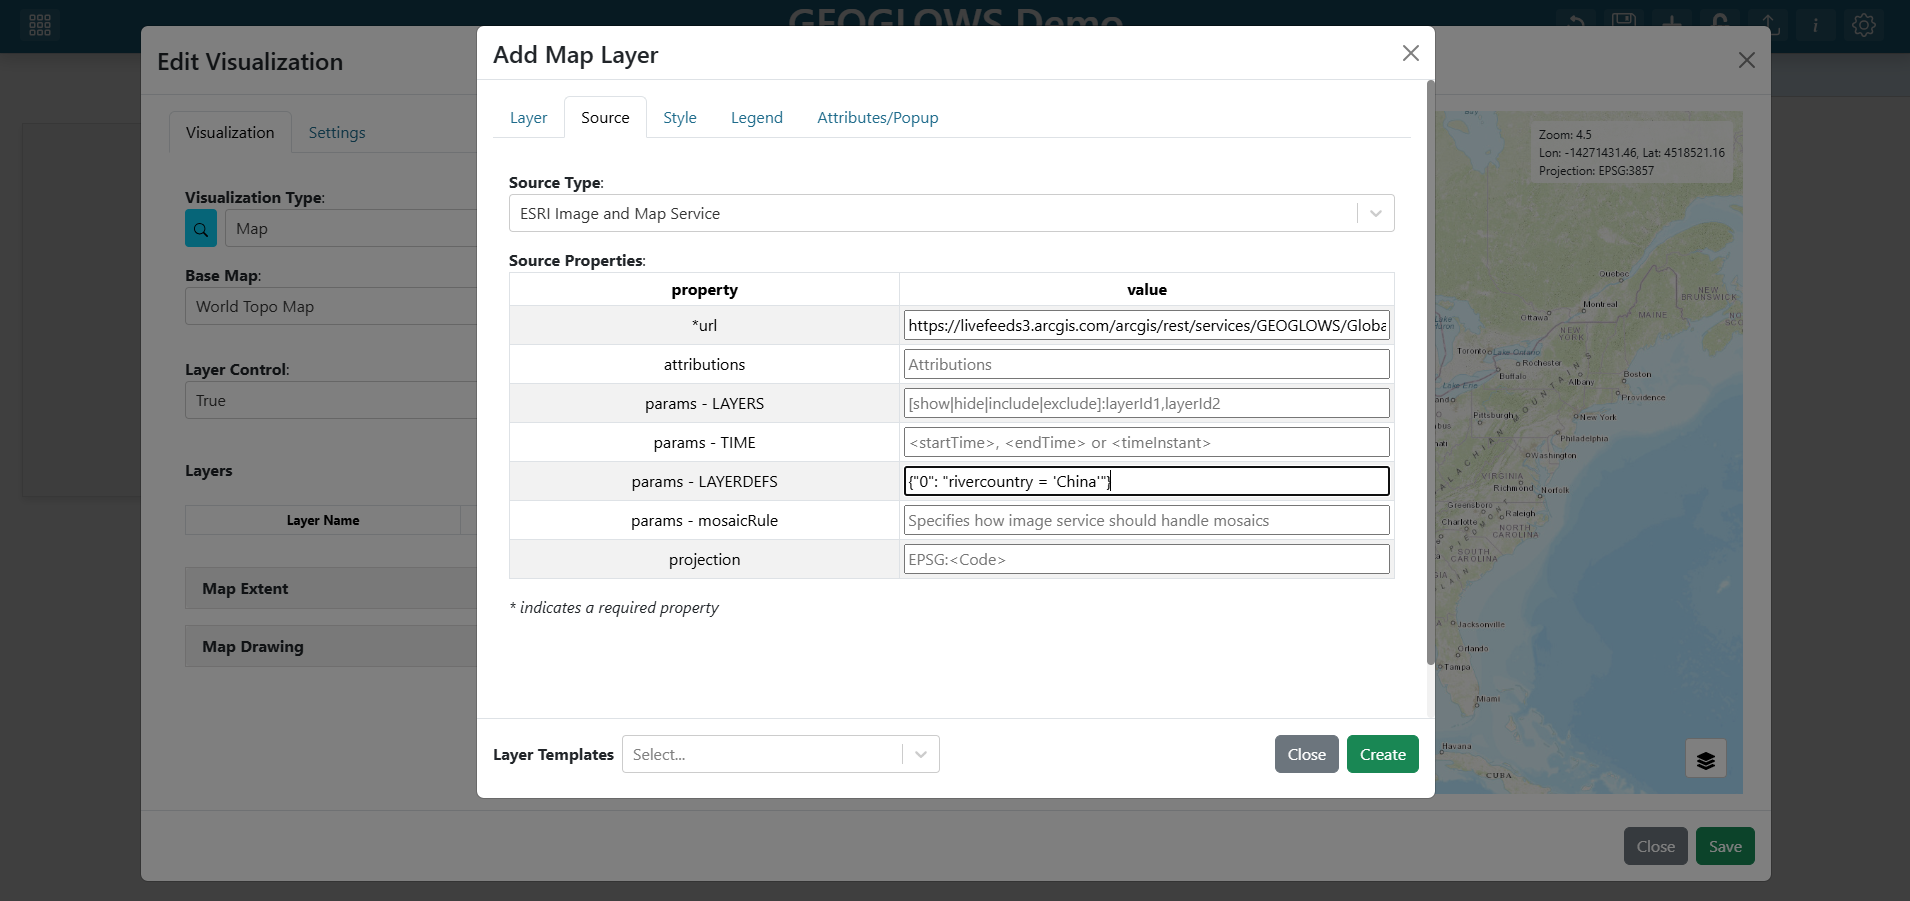
Step 4 — Edit the layer source
Click on the Source tab in the layer editor.
Click on the Source Type dropdown and select
ESRI Image and Map Service.Fill in the layer properties as follows:
URL:
https://livefeeds3.arcgis.com/arcgis/rest/services/GEOGLOWS/GlobalWaterModel_Medium/MapServerparams - LAYERDEFS:
{"0": "rivercountry = 'China'"}
Note
Why params - LAYERDEFS? The GEOGLOWS service covers the entire globe. Setting a layer definition query filters the service to only return river segments in China, which is much more performant and relevant for this dashboard. The value must be valid JSON with double quotes, and the layer index (0) is required to target the correct sublayer.
See the Source Tab for every supported source type and its props.
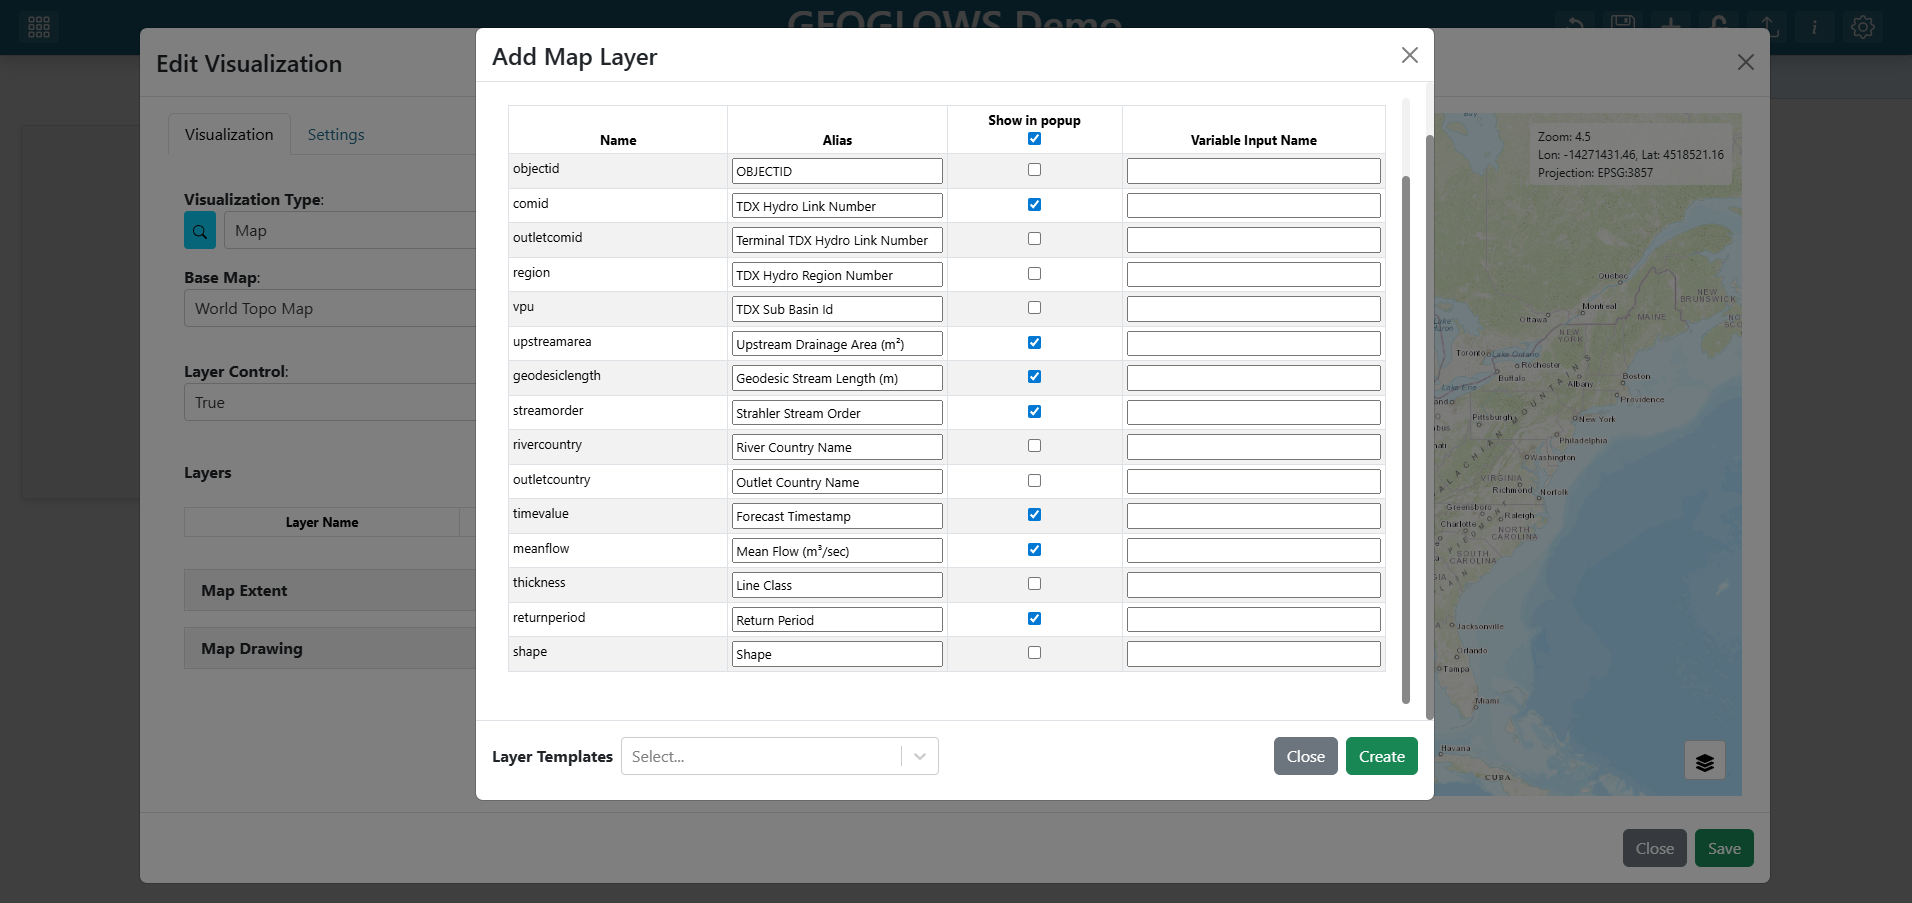
Step 5 — Edit attributes and popup
GEOGLOWS column names like objectid and shape are not user-friendly. Trim the popup so it only shows useful fields by omitting the following from Attributes/Table Popup:
objectidoutletcomidregionvpurivercountryoutletcountrythicknessshape
Note
See Attributes/Table Popup Tab for the full set of aliasing, omission, and click-binding options.
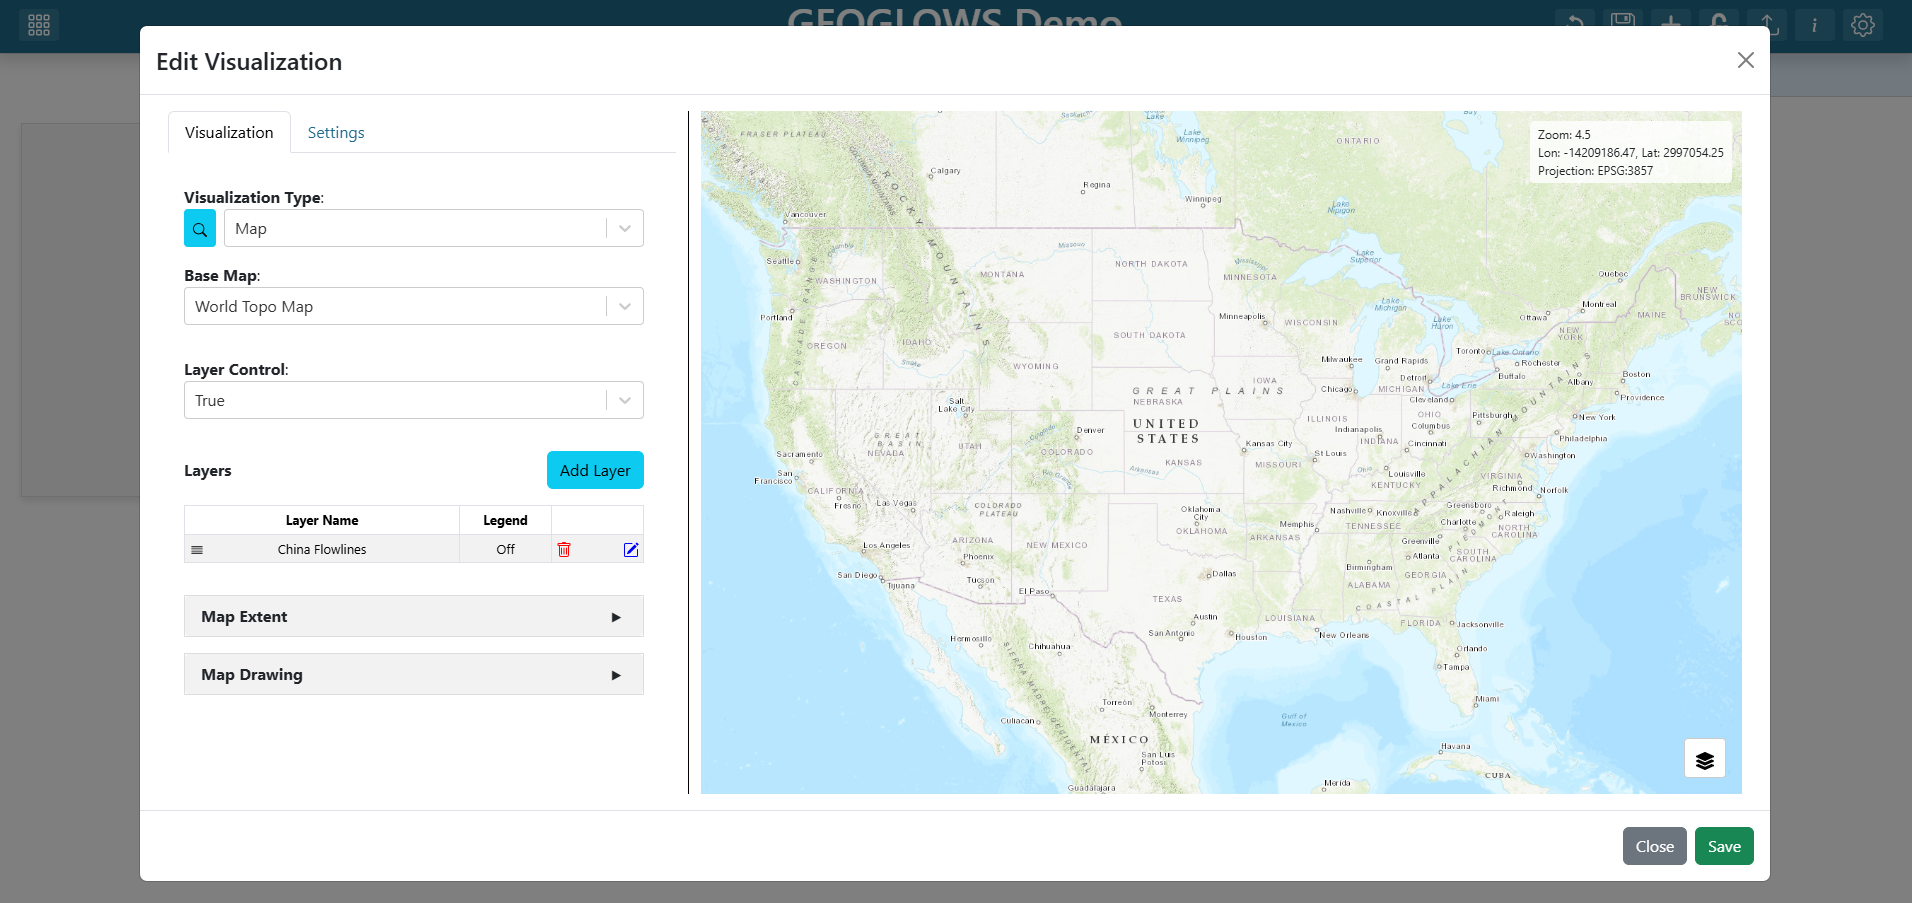
Step 6 — Save the layer
Click Create at the bottom of the layer editor. The layer collapses back into the map’s layer list and shows as China Flowlines.
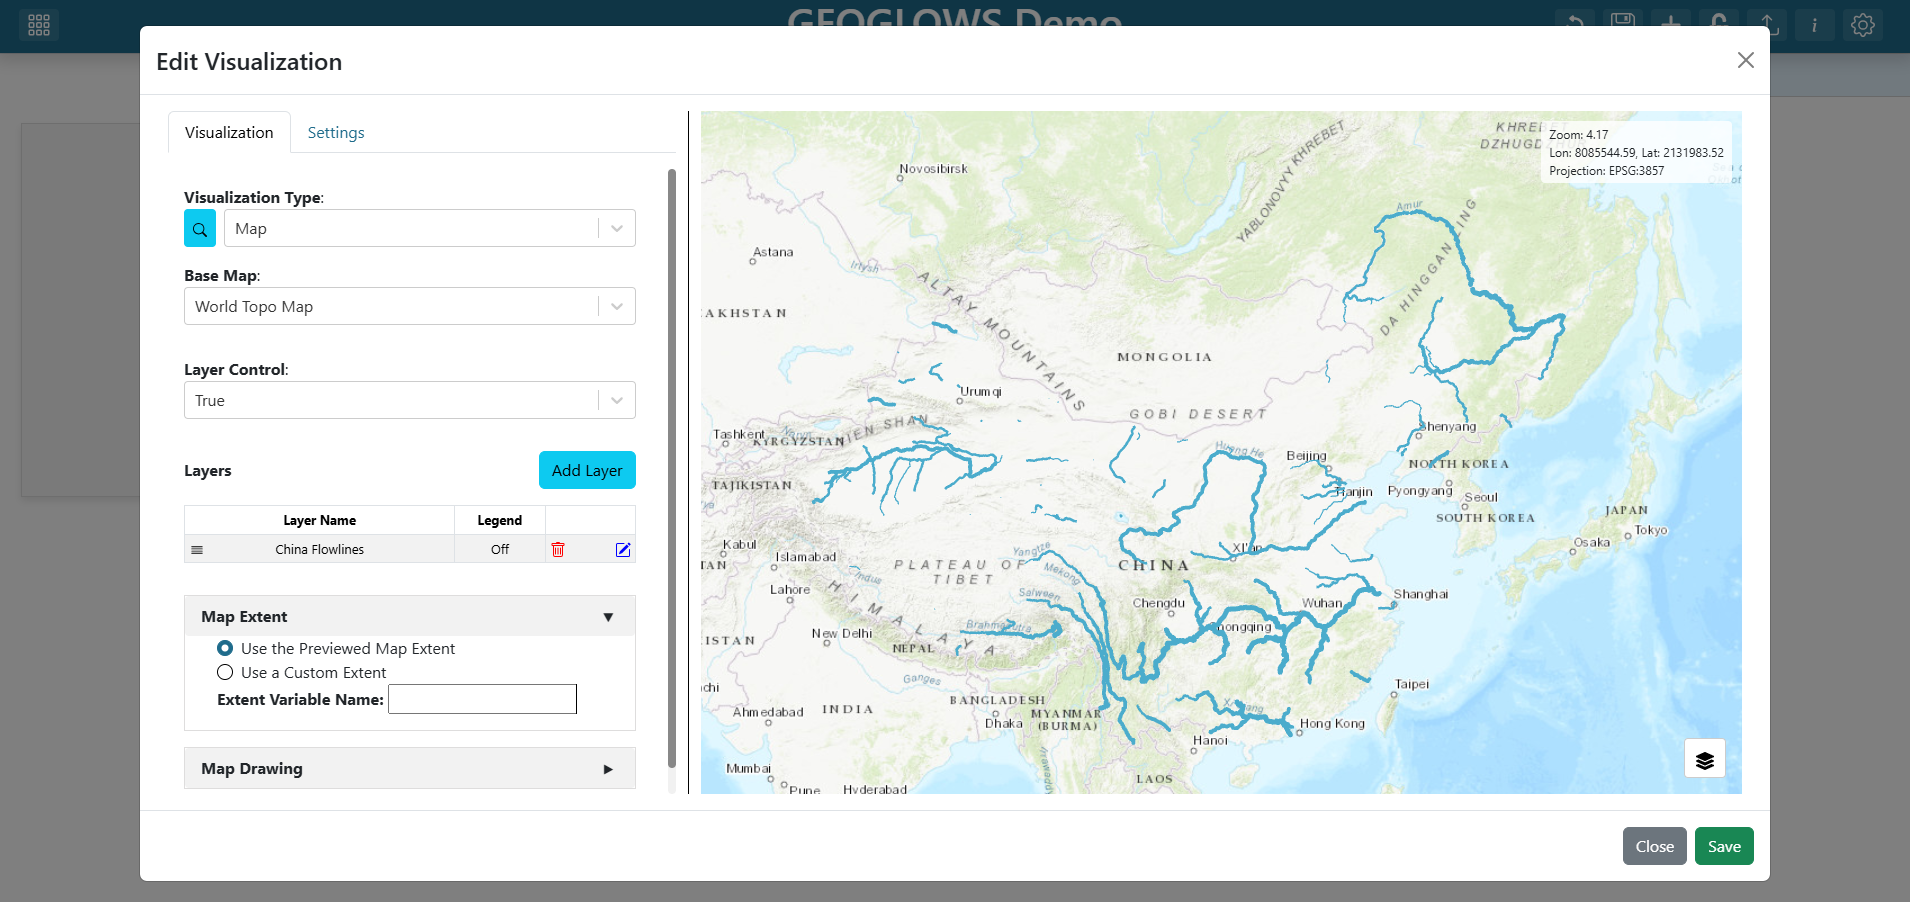
Step 7 — Edit the Map Extent
Expand the map editor’s Map Extent section.
Select Use the Previewed Map Extent option.
Step 8 — Save the map
Click Save at the bottom of the map’s grid item editor. The grid item now renders the GEOGLOWS service.
Click and drag the map grid item’s bottom-right corner to resize it to cover the entire dashboard.
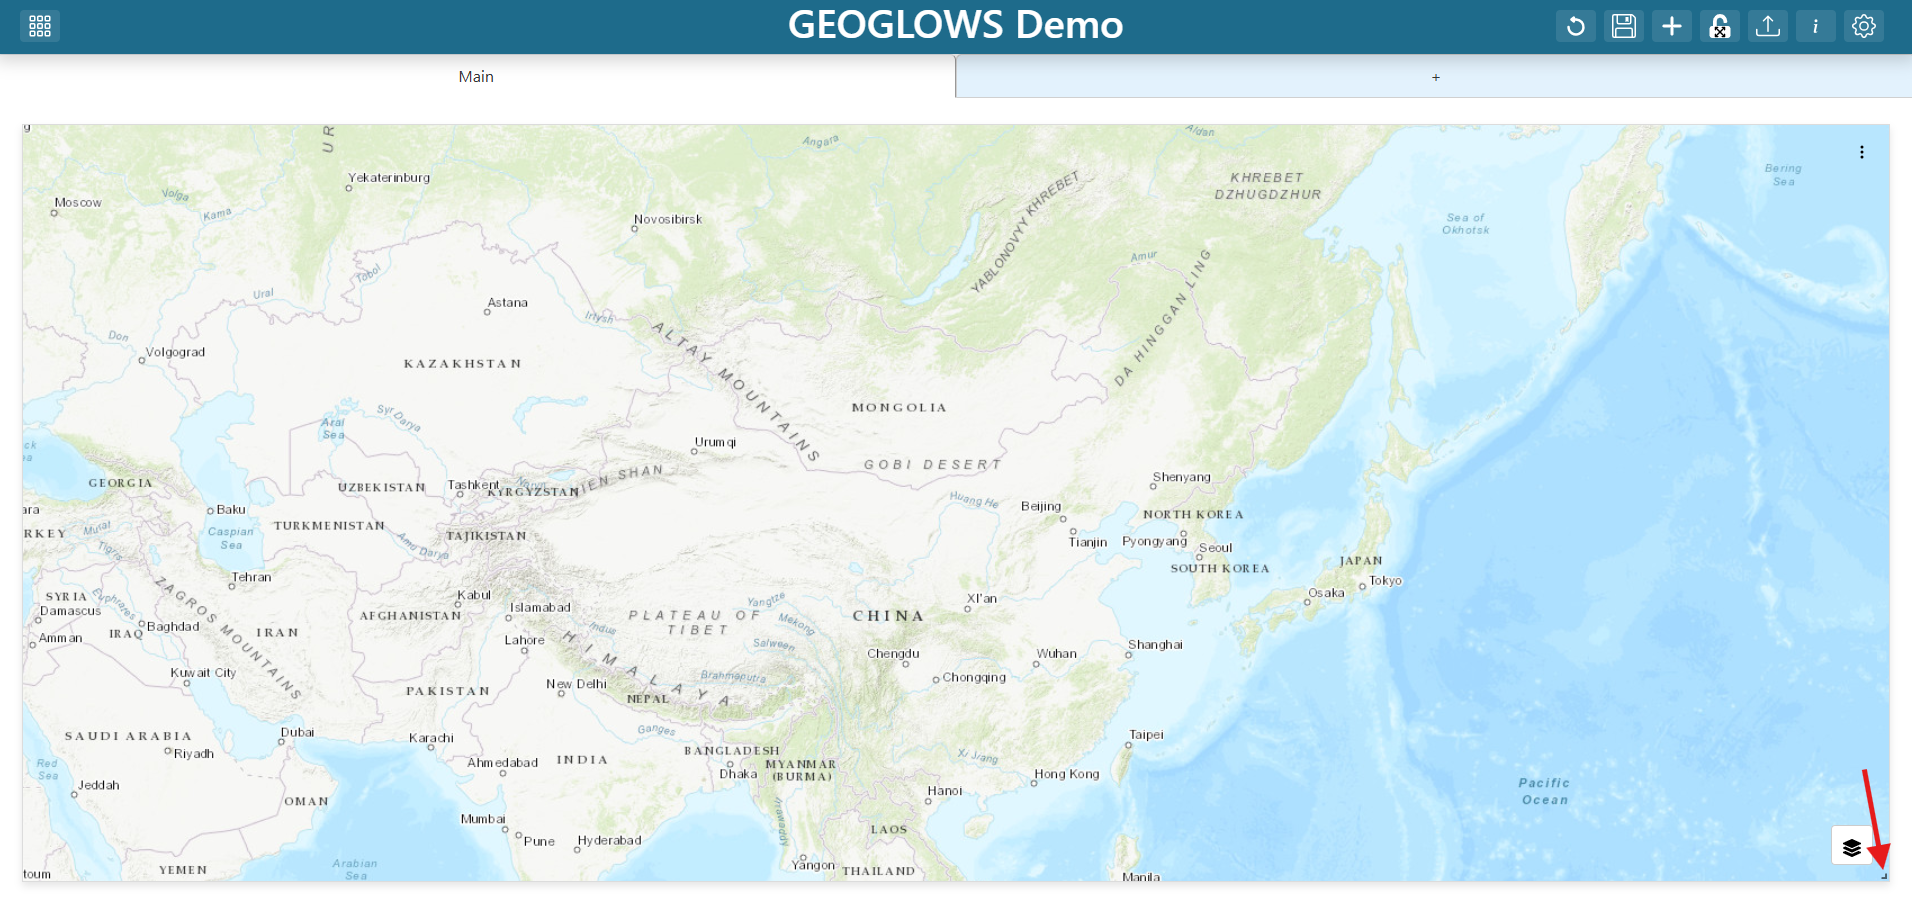
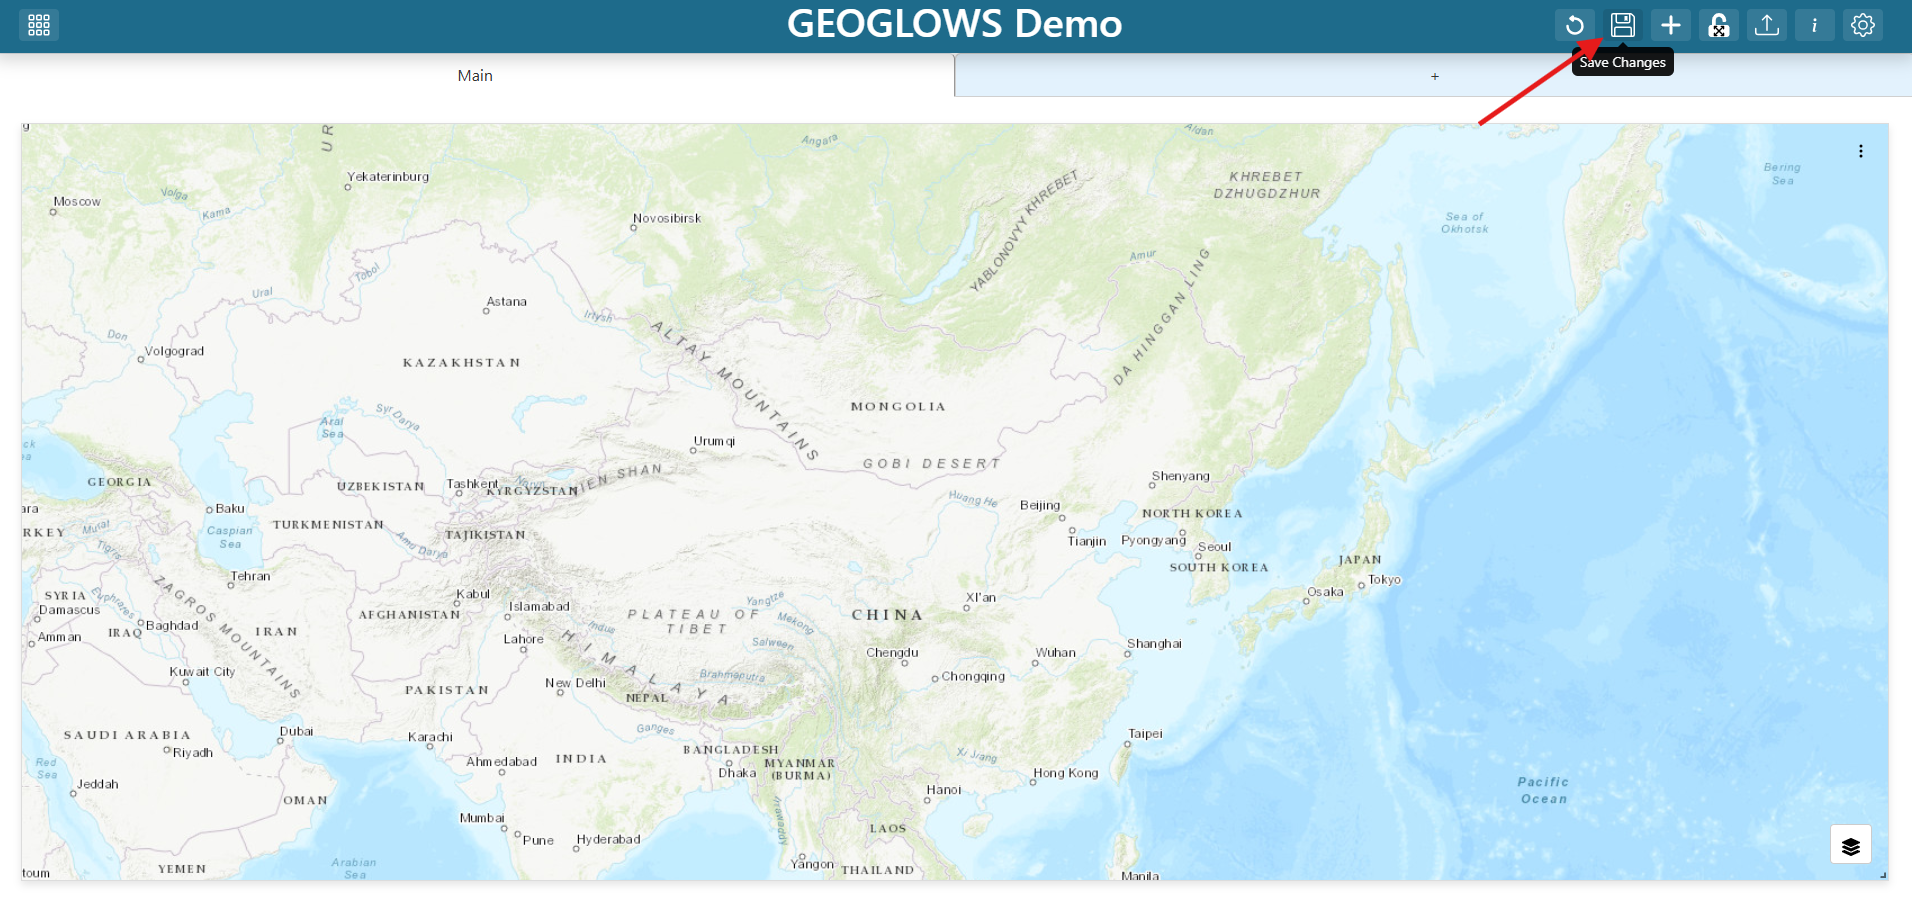
Step 9 — Save the dashboard
Click the Save (disk) icon in the dashboard toolbar to persist everything you have done so far.
Explore the map preview and test that the popups work. Don’t worry about the base map yet — you will make that dynamic in the next steps.
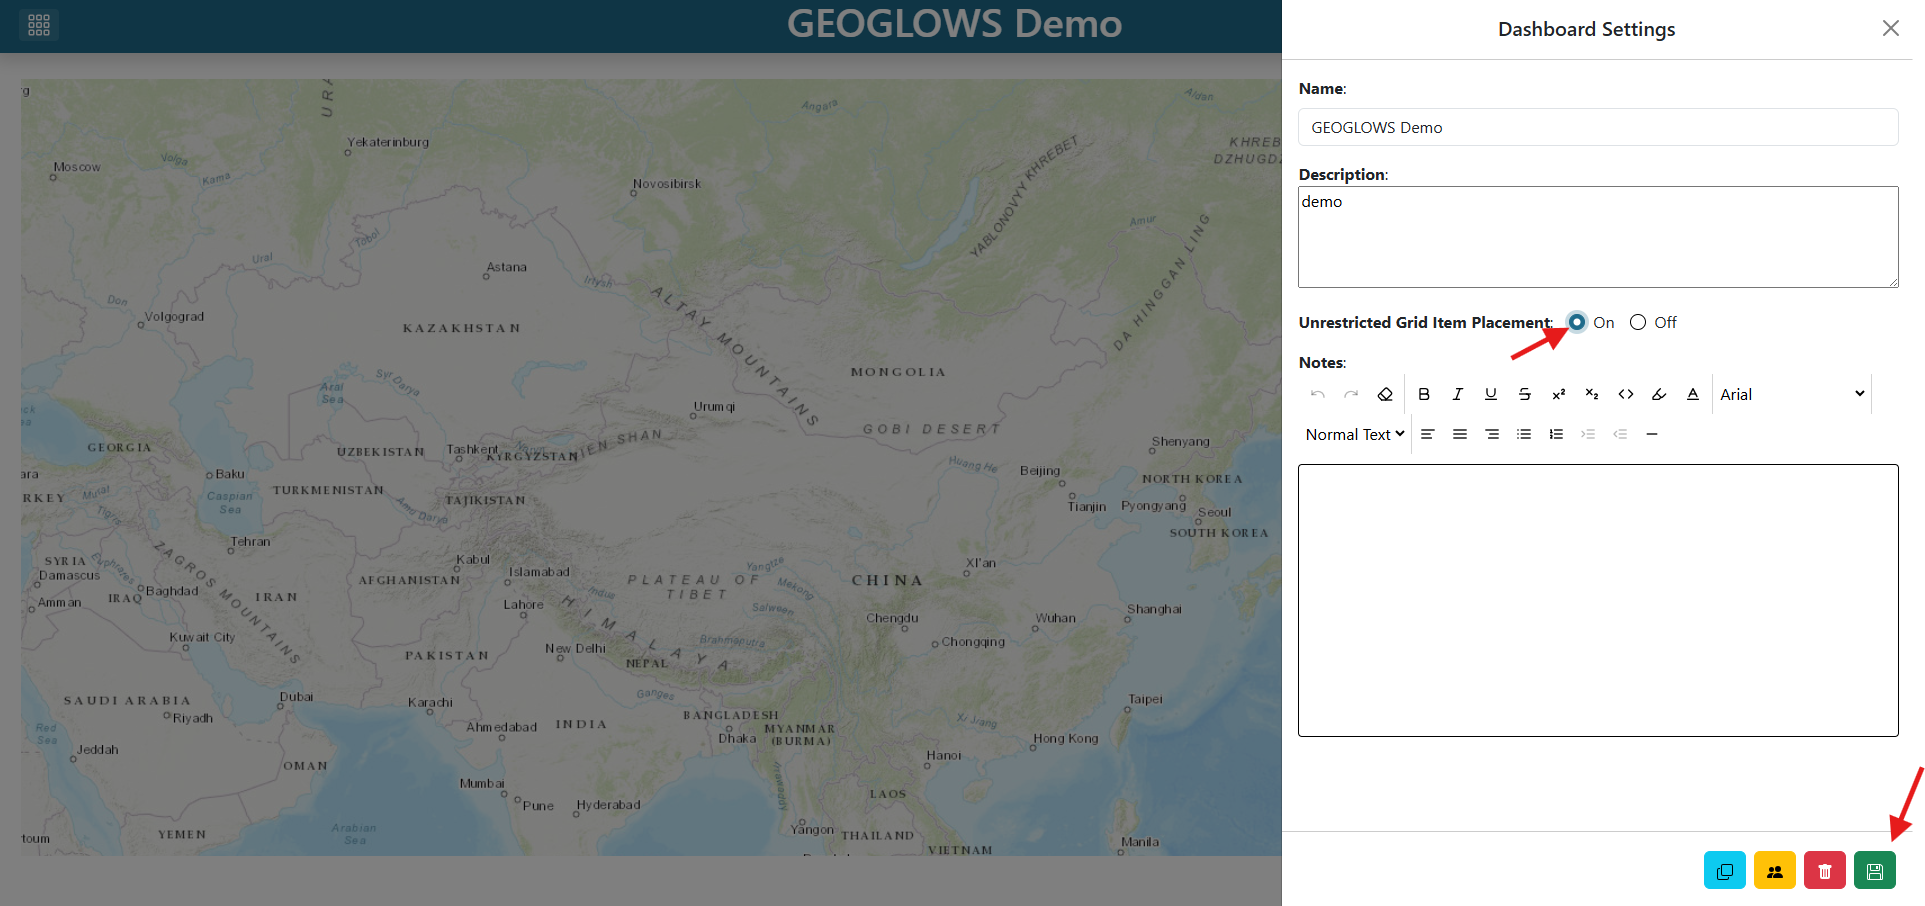
Step 10 — Update Dashboard Item Placement Restrictions
Click the dashboard Settings (gear) icon in the toolbar.
Scroll to the Unrestricted Grid Item Placement section.
Select the checkbox for On.
Click the Save (disk) icon at the bottom of the settings pane.
Close the settings pane.
Note
See Dashboard Settings & Saving for every option in the gear pane.
Step 11 — Re-enter edit mode
Click the Edit (pencil) icon to re-enter edit mode. You will now add a Variable Input.
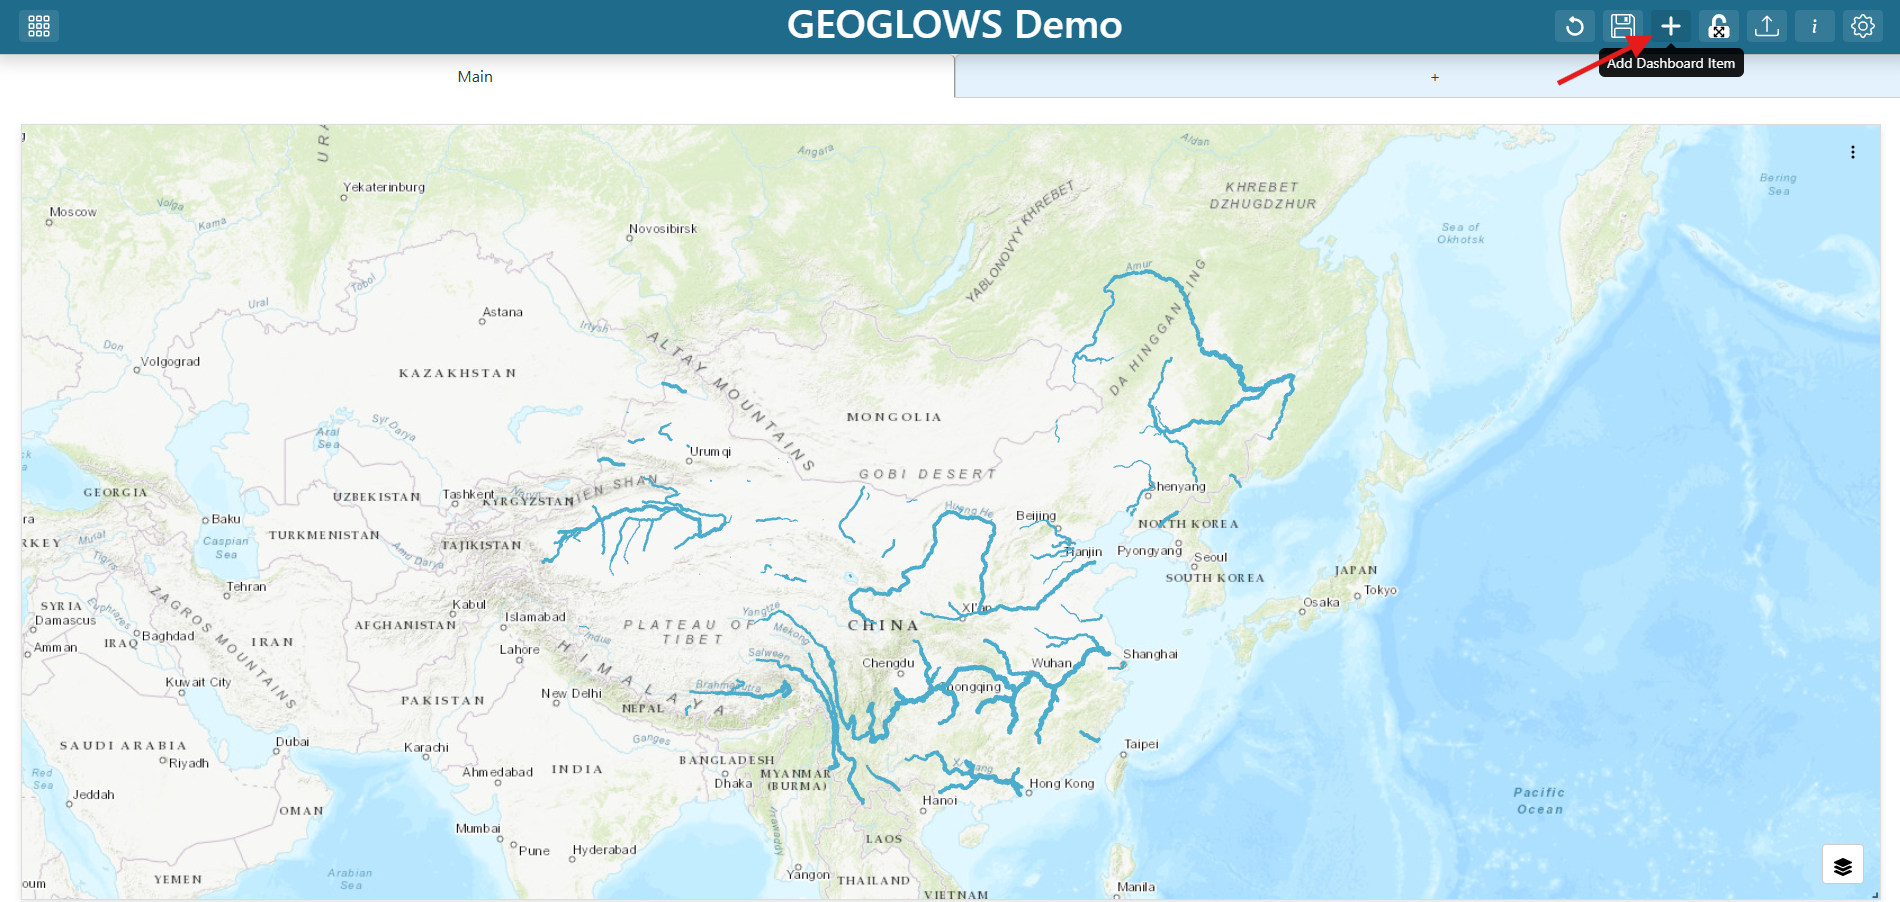
Step 12 — Add a Base Map variable input
Click + (Add Dashboard Item) in the toolbar.
Find the new grid item and click its three-dot menu.
Click Edit.
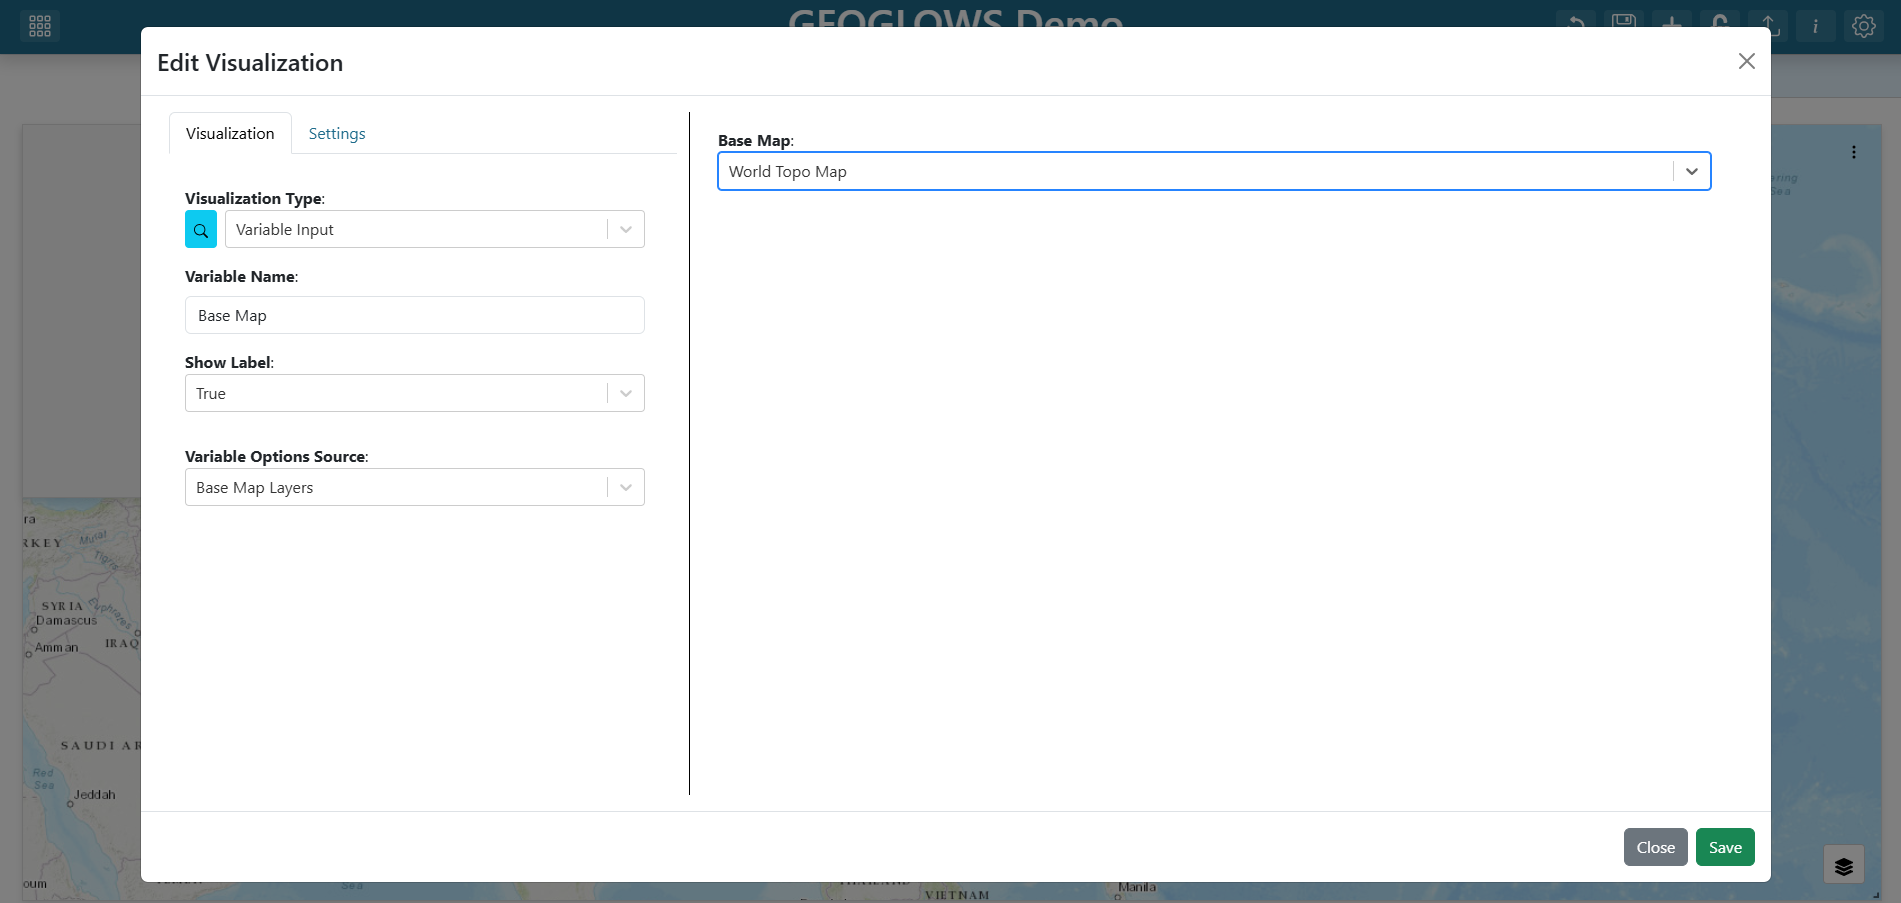
Set the Visualization Type to Variable Input under the Default section.
Set the variable input’s properties as follows:
Variable Name:
Base MapShow Label:
TrueVariable Options Source:
Base Map Layers
Note
Base Map Layers is a built-in options source that exposes TethysDash’s curated list of base map URLs. Using it here means the dropdown is automatically populated with valid base map services.
See Variable Inputs for all built-in options sources and how to define custom ones.
In the variable input editor preview, click the dropdown and select an initial base map (for example,
World Topo Map).Click Save at the bottom of the variable input editor.
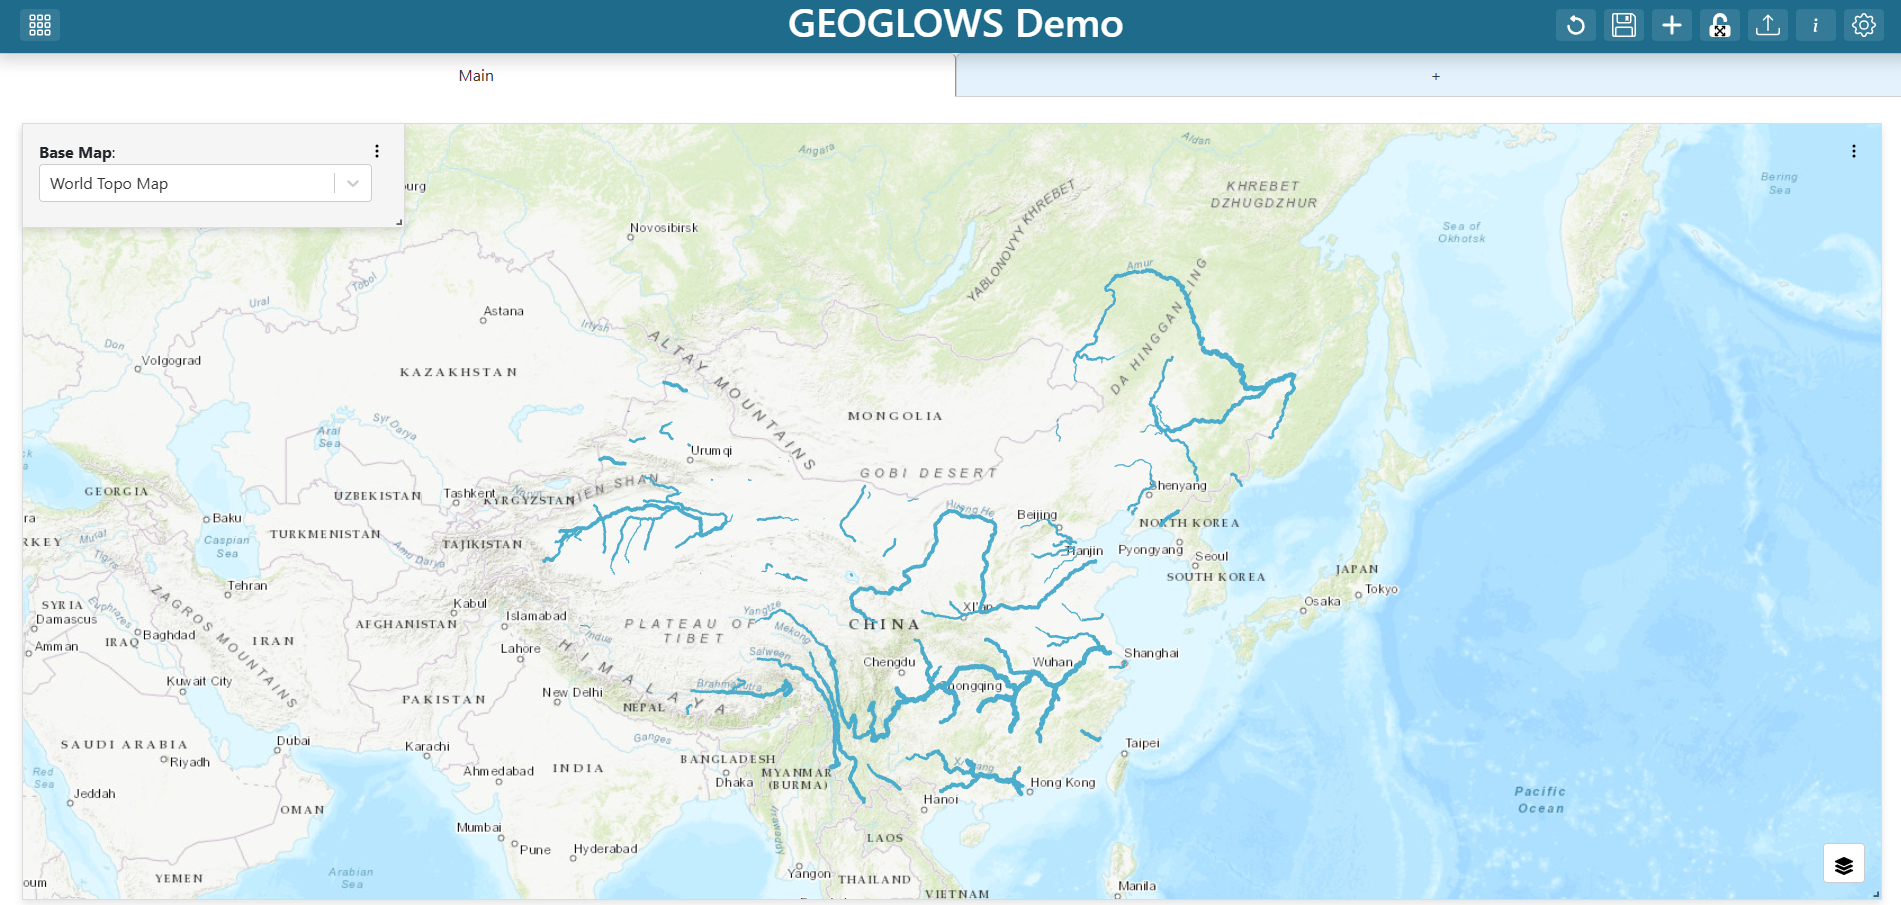
Resize and reposition the variable input as you like (for example, top-left corner as a floating item).
Step 13 — Edit the map
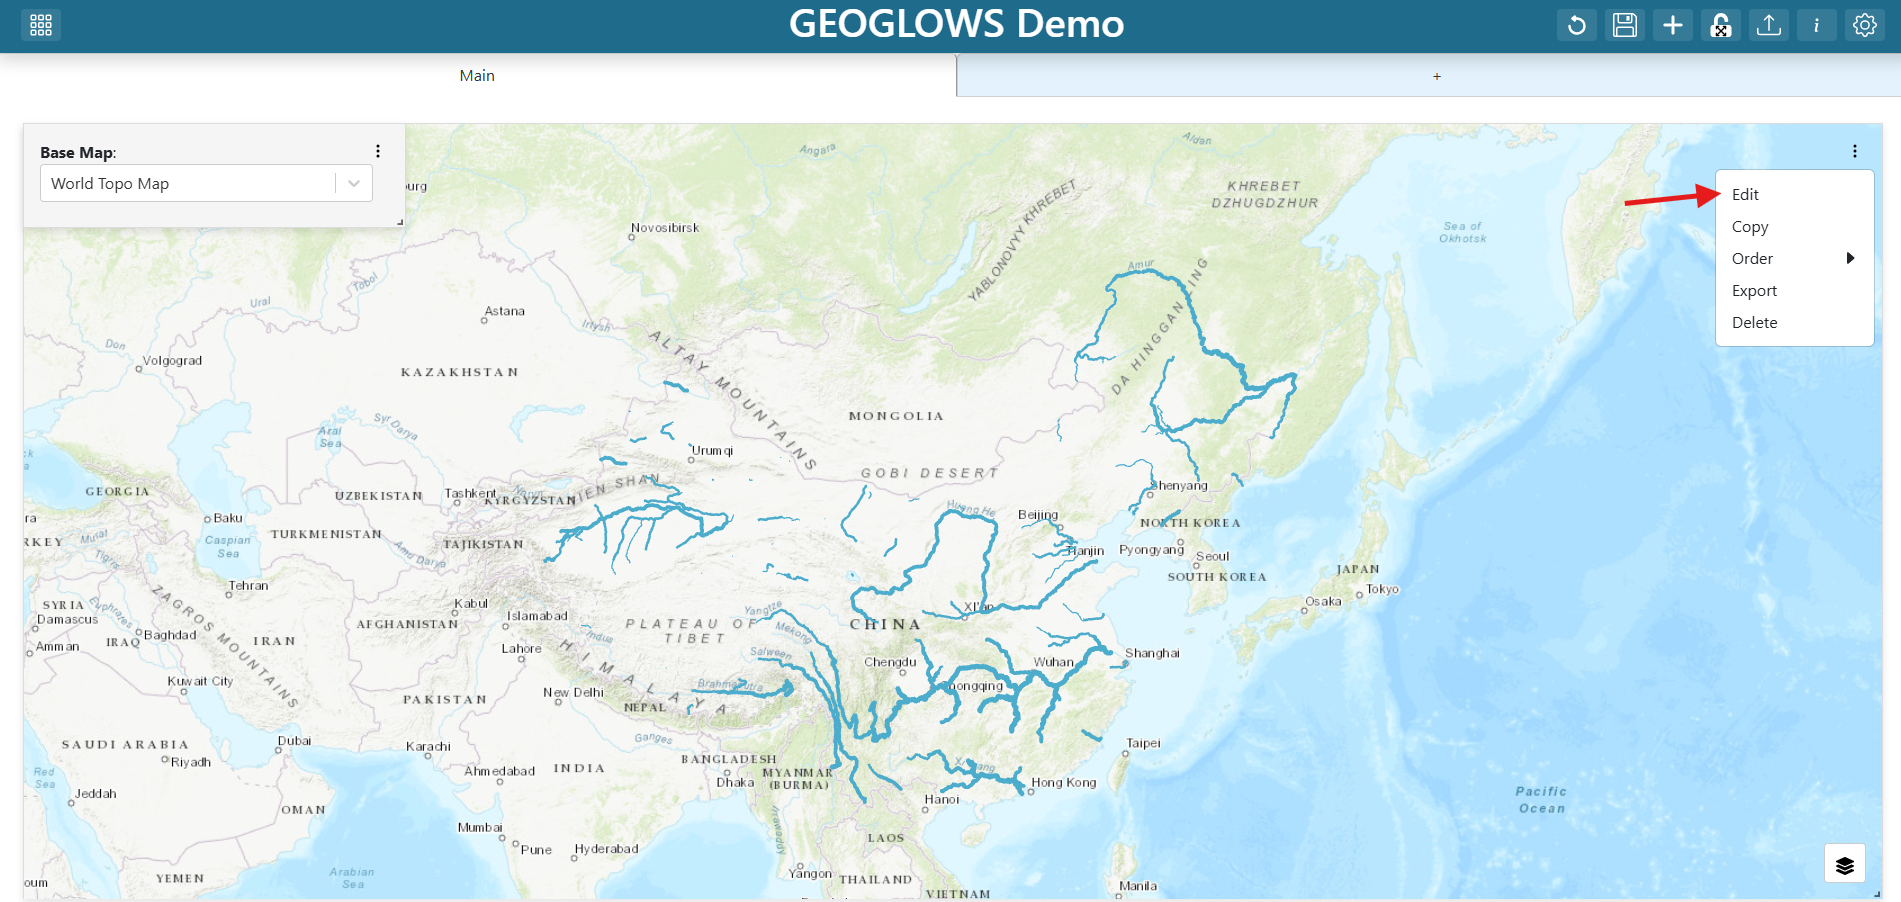
Find the map grid item and click its three-dot menu.
Click Edit.
Step 14 — Change the base map to reference the variable input
In the map’s Base Map field, replace whatever value is there with the template reference:
${Base Map}
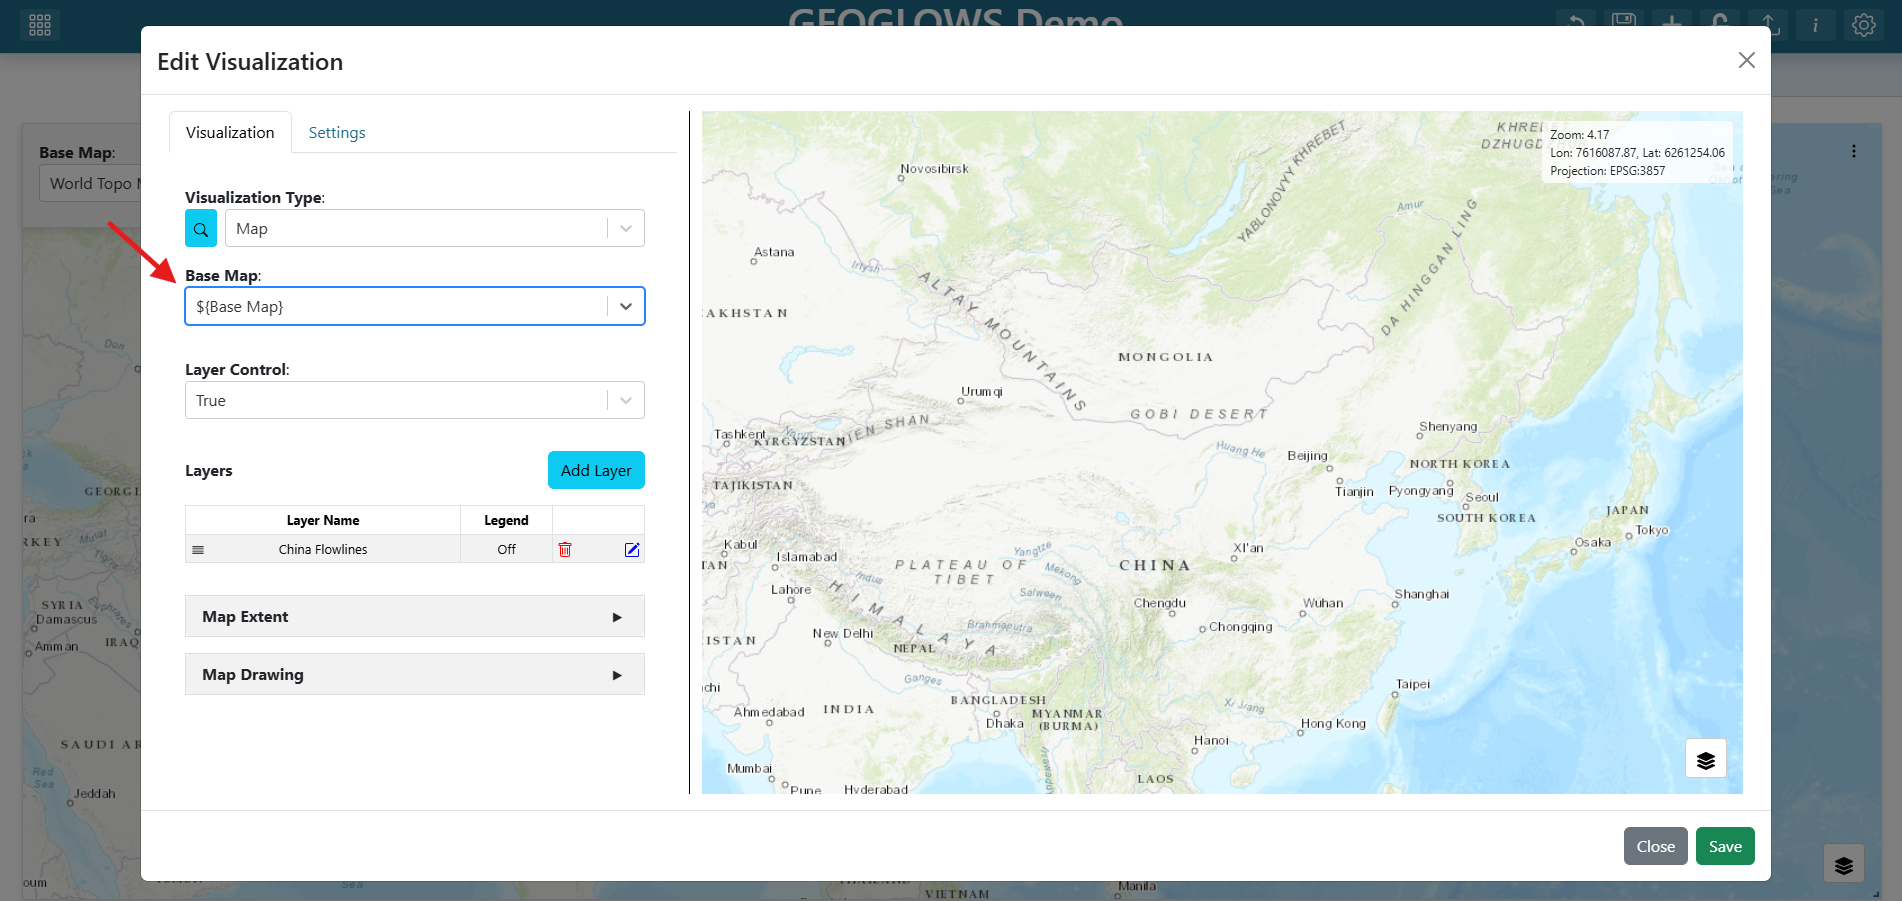
The ${...} syntax tells TethysDash to substitute in the current value of the variable input named Base Map whenever the map renders. Whenever the user picks a different option from the dropdown, the map re-renders with the new base map URL.
Note
See Variable Inputs for the full template-substitution semantics.
Step 15 — Save the map
Click Save in the map editor.
Step 16 — Save the dashboard
Click the dashboard Save (disk) icon in the toolbar once more to persist the variable input, the new base-map binding, and the final layout.
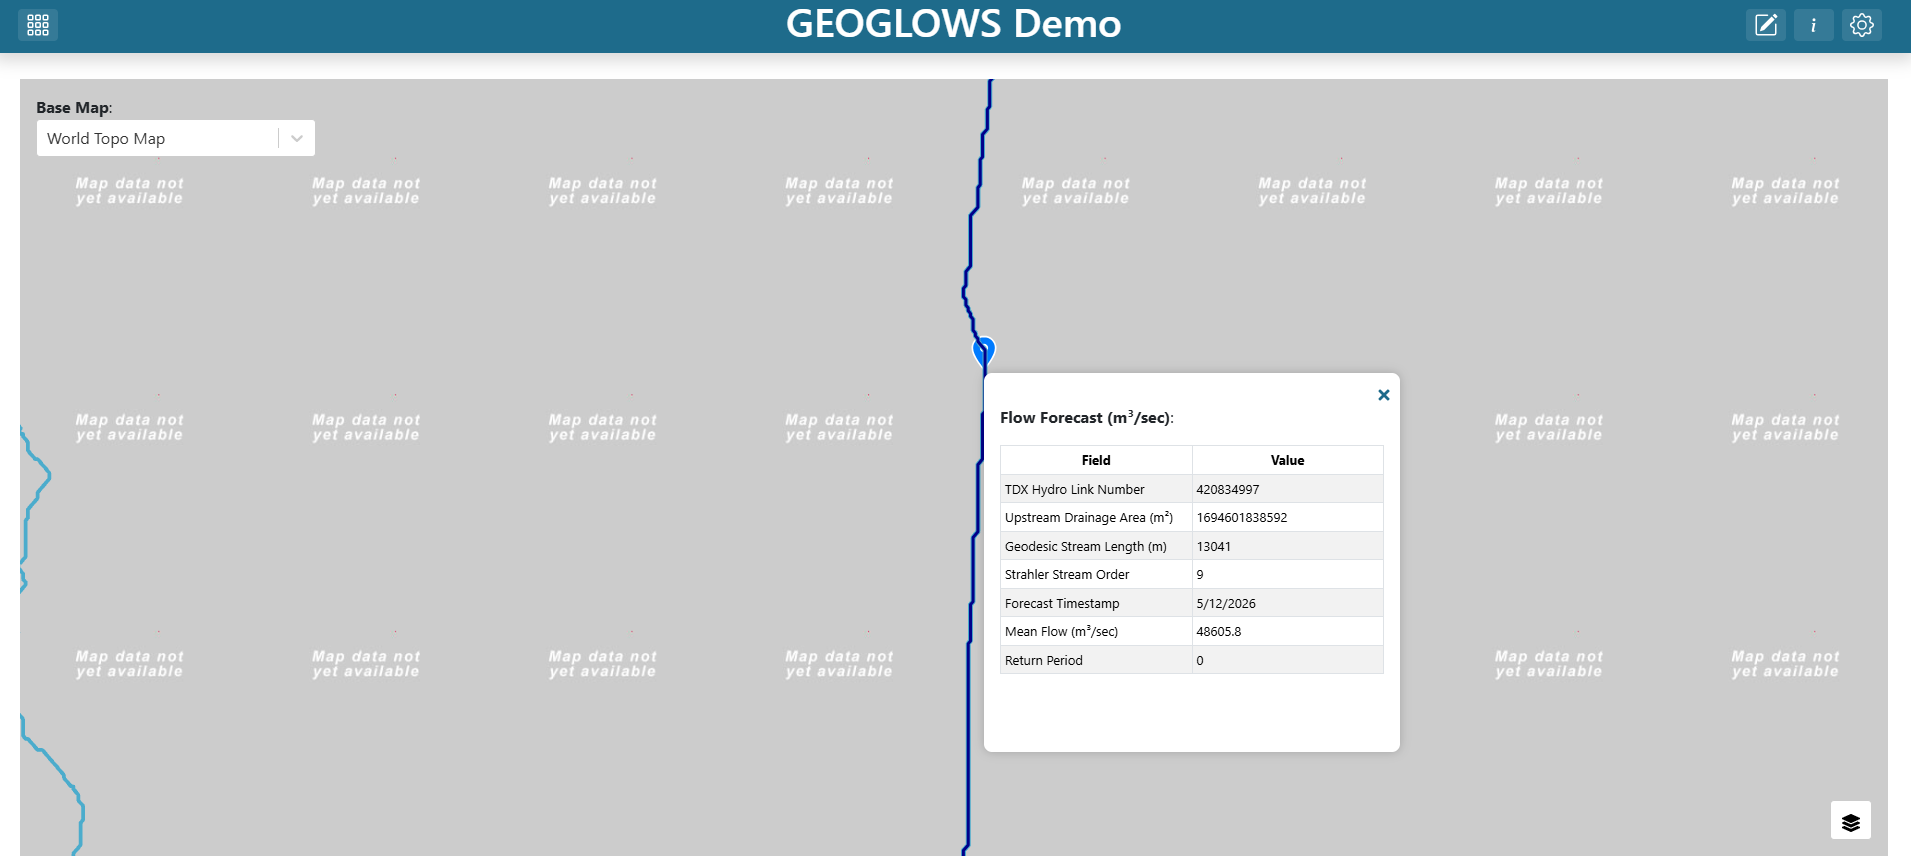
Step 17 — Explore
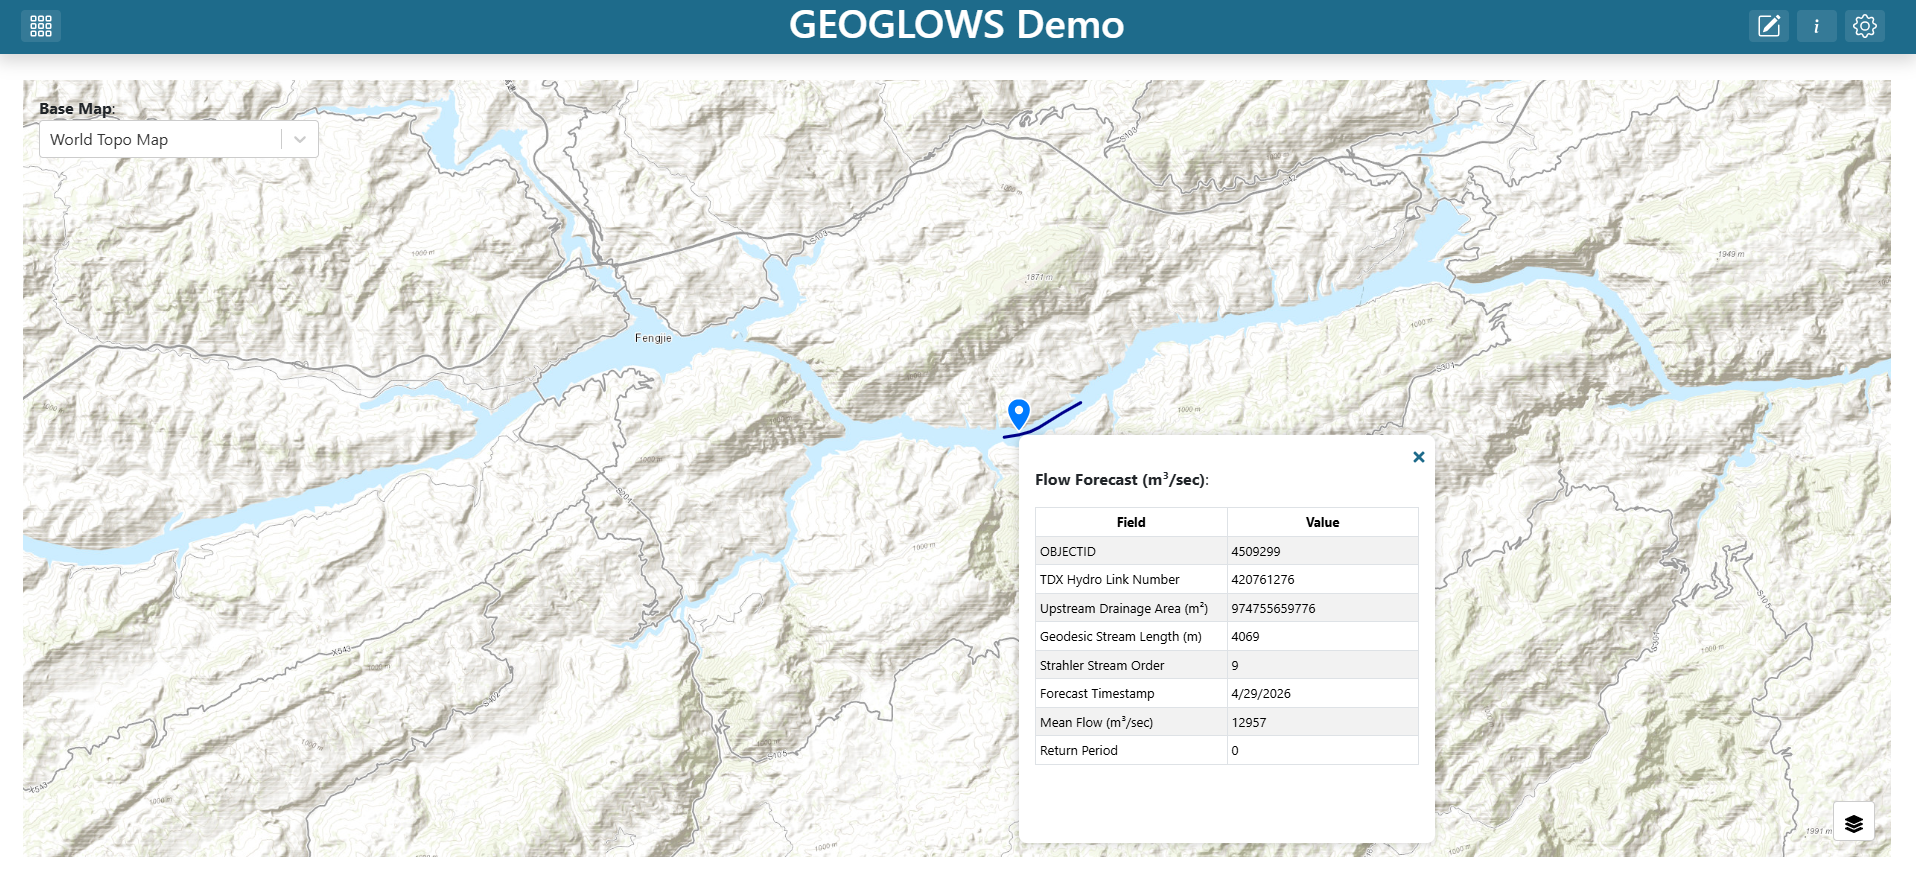
Change the base map by opening the Base Map dropdown and picking a different option (for example, an imagery base map). The base map should switch immediately while the flowlines stay in place.
Zoom in past zoom level 12 and click a river segment. The popup should show your friendly aliases and hide the omitted fields.
The map service is finicky when clicking for popups; you may need to zoom in very close to get popups to fire. This is a quirk of the service, not TethysDash, but it is worth being aware of as you test the dashboard.
Refresh the page. The dashboard should reopen at the China extent you saved, with the topo base map selected by default.
Troubleshooting
Flowlines never appear — Verify the URL is
https://livefeeds3.arcgis.com/arcgis/rest/services/GEOGLOWS/GlobalWaterModel_Medium/MapServerand theLAYERDEFSparameter is{"0": "rivercountry = 'China'"}. If the layer is misconfigured, the map will load but no flowlines will appear.Base map does not change when the dropdown changes — Confirm the map’s Base Map field is the literal string
${Base Map}(with the same capitalization and spaces as the variable input’s name). The substitution is name-sensitive.
Final Solution
GEOGLOWS_China_TethysDash.json
Note
This file can be imported into TethysDash via the Import Dashboard button on the landing page. Importing it will give you a working dashboard that matches the one you built in this tutorial, which you can then explore and edit as you like.