Visualization Plugins
Dashboard visualization plugins are created by subclassing the TethysDashPlugin base class, which provides integration with the intake package. While TethysDash uses Intake under the hood, plugin authors should focus on implementing subclasses of TethysDashPlugin rather than writing intake drivers directly. This section covers the requirements for creating plugins specifically for TethysDash, including setup, required properties, and methods. For examples, see the TethysDash Plugin Template repository.
Development
Creating a repository
Before developing a plugin, create a new repository for it. This allows others to clone and install the package as needed. While the file structure is flexible, following the structure in the TethysDash Plugin Template repository is recommended for compatibility. Be sure to add a static folder with visualization thumbnails to make your plugin easier to discover when users browse available visualizations (Configuring Visualizations).
TethysDash Plugin Class
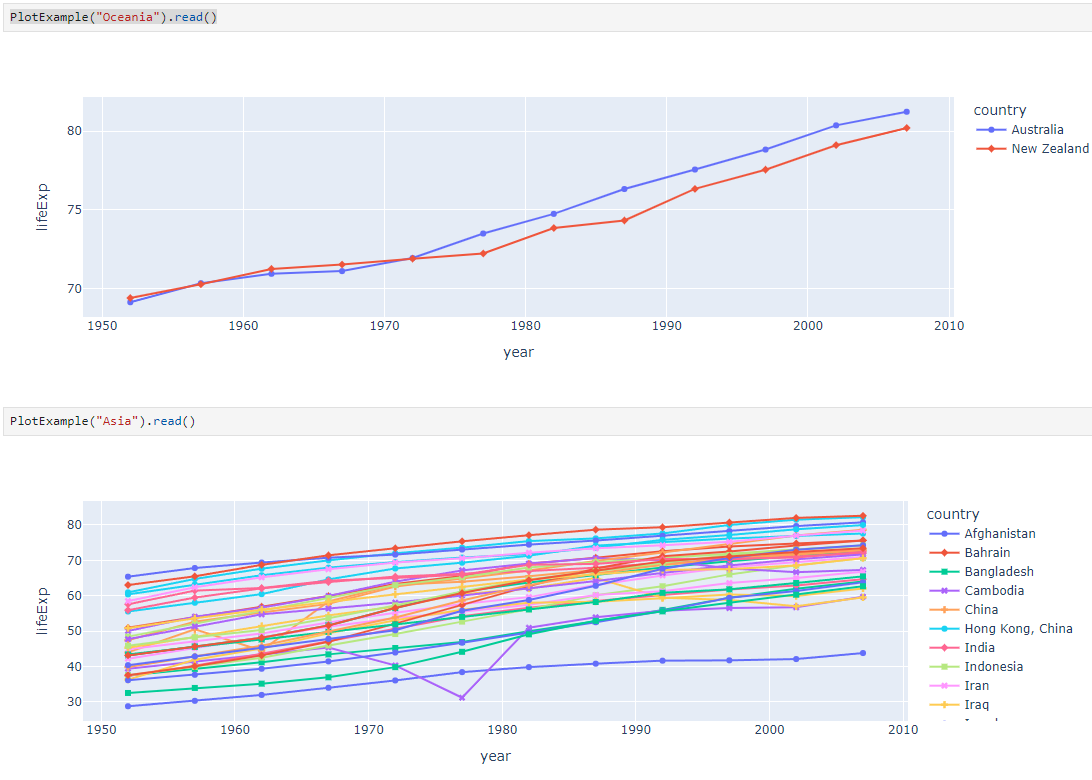
TethysDash offers a base class, TethysDashPlugin, for building custom visualization plugins. To create a plugin, subclass TethysDashPlugin and define the required properties described below. The primary method to implement is run, which TethysDash will call to generate and return the visualization data.:
from tethysapp.tethysdash.plugin_helpers import TethysDashPlugin
import plotly.express as px
import json

class PlotExample(TethysDashPlugin):
    name = 'plot_example'
    args = {"continent": "text"}
    group = "Example"
    label = "Example Plot"
    type = "plotly"
    tags = [
        "example",
        "plotly",
    ]
    description = "An example plugin for the plotly visualization"

    def run(self):
        """Return a version of the xarray with all the data in memory"""
        df = px.data.gapminder().query(f"continent == '{self.continent}'")
        fig = px.line(df, x="year", y="lifeExp", color="country", symbol="country")
        return json.loads(fig.to_json())
- Properties:
name: (required) Name of the package. Used for installation and as the driver name (e.g., intake.open_<driver_name>).
group: (required) Used to group visualizations in the dashboard app.
label: (required) The display name for the visualization in the dashboard app.
type: (required) The type of visualization. Must be “plotly”, “table”, “image”, “imageCollection”, “card”, “text”, “variable_input”, “map”, “map_layer”, or “custom”. See the Plugin Visualization Types section for details.
args: Dictionary of function arguments as keys and data types as values. Used to dynamically create HTML inputs. Values can be HTML Input Types or a list for dropdowns (e.g., {“year”: “number”, “location”: “text”, “available_colors”: [“red”, “blue”, “white”]}). Simple args are set as attributes of the plugin class and can be used in the run method using self (e.g., self.year, self.location, self.available_colors). Date args are parsed to
datetimeobjects, and dropdown args may declare nestedsub_args. See Accessing Arguments in run() for how each kind reachesrun(). Argument names must not contain.(the reserved nested-argument path delimiter).tags: List of tags for search and discovery.
description: Description of the visualization.
restricted: Boolean to restrict access to the plugin. If true, the plugin will only be visible to users with permissions. Defaults to false.
loading_icon: Boolean to enable a loading icon when the plugin is loading data. Defaults to true.
attribution: Description of the data source for attribution purposes. Optional.
- Methods:
run: The main function to implement. The dashboard app calls this method and uses its results as the visualization data.
get_arg: Read a single argument by its flat (possibly dotted) name, e.g.
self.get_arg("transect_location.location"). ReturnsNone(or a supplied default) when the argument was not provided. Use this for nested args, which attribute access cannot reach. See Accessing Arguments in run().sub_args: Return the immediate child arguments of a nested (dropdown) arg as a
{child_name: value}dictionary, e.g.self.sub_args("transect_location"). See Accessing Arguments in run().send_update: A method to send updates from the plugin to the dashboard app. Useful for long-running processes to provide progress updates. See the Sending Progress Updates section for more information.
Accessing Arguments in run()
Arguments configured for a plugin are made available on the plugin instance
before run() is called. How you read an argument depends on its type.
Simple arguments are set as attributes named after the argument key:
args = {"year": "number", "location": "text"}
# in run():  self.year, self.location
Date arguments ("date") are automatically parsed into datetime
objects before run() is called, so self.<arg> is a datetime rather
than a string. Date inputs also accept special string values:
Relative date math such as
"now","now-7D", or"now+30D"is resolved to adatetimefor you.
"latest"is a preset meaning “the newest available data”. Unlike the values above it is not parsed — it reachesrun()as the literal string"latest", and the plugin is responsible for resolving it (e.g. by discovering the most recent available file/resource).
Detect the preset before treating the value as a date:
def run(self):
    if self.get_arg("date") == "latest":
        return self._resolve_latest()
    # self.date is a datetime here
    ...
Nested (dropdown) arguments. A dropdown argument option may declare
sub_args — additional inputs revealed only when that option is selected.
These arrive as a flat map with dotted keys joining the parent and child
names (e.g. "transect_location.location"), not as a nested dictionary.
Because Python cannot resolve a dotted name through attribute access
(self.transect_location.location does not work), read them with the
helper methods:
args = {
    "transect_location": [
        {
            "value": "coast",
            "label": "Coastal",
            "sub_args": {"location": [{"value": "60.0_220.0", "label": "60.0N 140.0W"}]},
        },
    ],
}

def run(self):
    transect = self.transect_location                      # "coast" (attribute access OK)
    location = self.get_arg("transect_location.location")  # selected sub-value
    # or read all immediate children at once:
    options = self.sub_args("transect_location")           # {"location": ...}
    ...
sub_args returns only the immediate children of a parent; descend one
level at a time for deeper nesting (e.g. self.sub_args("transect_location.location")).
Note
Argument names must not contain . — it is reserved as the
nested-argument path delimiter. TethysDashPlugin raises a ValueError
at instantiation if a top-level argument name contains one. Sub-arg names
declared inside dropdown options are subject to the same rule.
Plugin Visualization Types
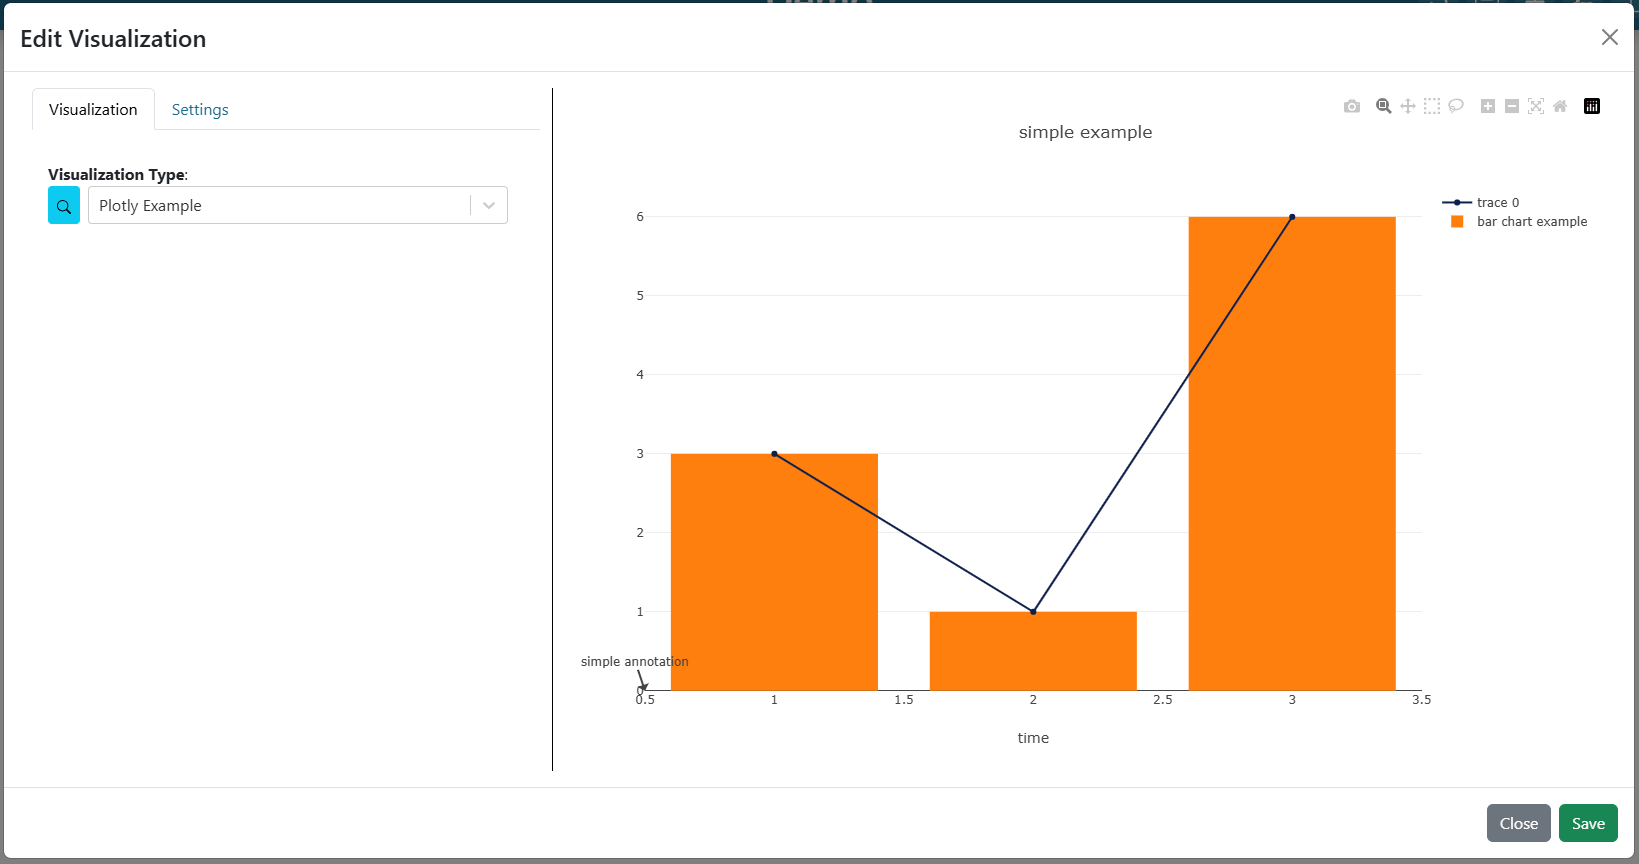
Plotly Chart
Displays a Plotly chart with the provided data, layout, and configuration.
visualization_type: plotly
- read return: (dictionary)
data (required): A list of plotly traces (see Scatter Trace as an example)
layout (optional): A dictionary of a Plotly Layout configuration.
config (optional): A dictionary of a Plotly Figure configuration for adding buttons, interactions, etc.
Example:
from tethysapp.tethysdash.plugin_helpers import TethysDashPlugin
import plotly.graph_objects as go

class PlotlyExample(TethysDashPlugin):
    name = "plotly_example"
    group = "Example"
    label = "Plotly Example"
    type = "plotly"
    tags = [
        "example",
        "plotly",
    ]
    description = "An example plugin for the plotly visualization"

    def run(self):
        """Return plotly information"""

        Return plotly information
        """
        data = [
            {
                "type": "scatter",  # all "scatter" attributes: https://plotly.com/javascript/reference/#scatter
                "x": [1, 2, 3],  # more about "x": #scatter-x
                "y": [3, 1, 6],  # #scatter-y
                "marker": {  # marker is an object, valid marker keys: #scatter-marker
                    "color": "rgb(16, 32, 77)"  # more about "marker.color": #scatter-marker-color
                },
            },
            {
                "type": "bar",  # all "bar" chart attributes: #bar
                "x": [1, 2, 3],  # more about "x": #bar-x
                "y": [3, 1, 6],  # #bar-y
                "name": "bar chart example",  # bar-name
            },
        ]

        layout = {  # all "layout" attributes: #layout
            "title": "simple example",  # more about "layout.title": #layout-title
            "xaxis": {  # all "layout.xaxis" attributes: #layout-xaxis
                "title": "time"  # more about "layout.xaxis.title": #layout-xaxis-title
            },
            "annotations": [  # all "annotation" attributes: #layout-annotations
                {
                    "text": "simple annotation",  # #layout-annotations-text
                    "x": 0,  # #layout-annotations-x
                    "xref": "paper",  # #layout-annotations-xref
                    "y": 0,  # #layout-annotations-y
                    "yref": "paper",  # #layout-annotations-yref
                }
            ],
        }

        config = {"displayModeBar": True}

        return {"data": data, "layout": layout, "config": config}
Subplot Show/Hide Toggle
For figures built from multiple subplots, a plugin can let viewers show and hide individual subplots from a control in the top-right corner of the plot. When a subplot is hidden, the remaining subplots reflow to fill the freed space.
To opt in, return toggle_subplots: True as a top-level key alongside
data/layout/config:
return {
    "data": data,
    "layout": layout,
    "config": config,
    "toggle_subplots": True,
}
That single key is all that is required. The frontend discovers the subplots (“panes”) from the figure’s axes:
Traces are grouped into a pane by their
xaxis/yaxisassignment. Secondary-y overlays (an axis withoverlaying) are folded into the pane of the axis they overlay.Each pane’s checkbox label comes from its y-axis
title→ else the first tracename→ else"Subplot N".Toggling a pane off hides its traces and its dedicated axes (axes shared with another pane are never hidden), then recomputes the domains of the remaining visible panes. Axes are only hidden and re-domained, never removed, so
matches/zoom-linking is preserved.
The toggle state is ephemeral (it resets on reload) and at least one pane always remains visible.
Reflow. Reflow is only applied when the subplots form a single row-stack (shared x-domain, stacked y-domains) or column-strip (the mirror). Grids, insets, and non-cartesian subplots (polar/geo/3D) fall back to visibility-only — panes hide but the layout does not reflow. To override the auto-detection, return an optional hint:
"subplot_toggle": {"reflow": "vertical"} # or "horizontal" or "none"
Checkbox labels. By default each checkbox is labeled from the subplot’s
primary y-axis title → else the first trace name → else "Subplot N".
If your y-axis titles are units (e.g. "°F", "m/s") the labels will be
units and may repeat, so you can supply explicit labels keyed by axis reference
("y", "y3", …) or layout key ("yaxis", "yaxis3", …):
"subplot_toggle": {
    "labels": {"y": "Temperature", "y3": "Pressure", "y5": "Wind Speed"},
}
You can build this from each subplot’s primary axis (see get_subplot_axes).
Any pane without an explicit label uses the default fallback above.
Tying annotations, shapes, and images to a subplot. So that titles,
drawings, and images for a hidden subplot are hidden (and reflow) along with it,
anchor them to that subplot’s axes rather than to the paper. The frontend
ties a layout item to a pane by resolving its xref/yref:
Drawings/shapes that live in data coordinates already work — e.g. a shape with
"xref": "x3", "yref": "y5"is tied to that subplot, hides with it, and follows reflow automatically.Subplot titles / annotations should use the axis domain reference instead of
"paper"so they both hide and reflow with their subplot:# Instead of an absolute paper position: {"text": "Wind Speed", "xref": "paper", "yref": "paper", "x": 0, "y": 0.65} # Anchor to the subplot's axes (here the Wind row uses x3 / y5): {"text": "Wind Speed", "xref": "x3 domain", "yref": "y5 domain", "x": 0, "y": 1, "xanchor": "left", "yanchor": "bottom"}
Images likewise: a paper-anchored logo stays put (often desired), while an image anchored to a subplot’s axis is tied to it.
Items that cannot be tied to a single subplot (paper-anchored, spanning multiple panes, or anchored only to a shared axis) are left untouched — for example a full-height vertical line drawn across all subplots is never hidden.
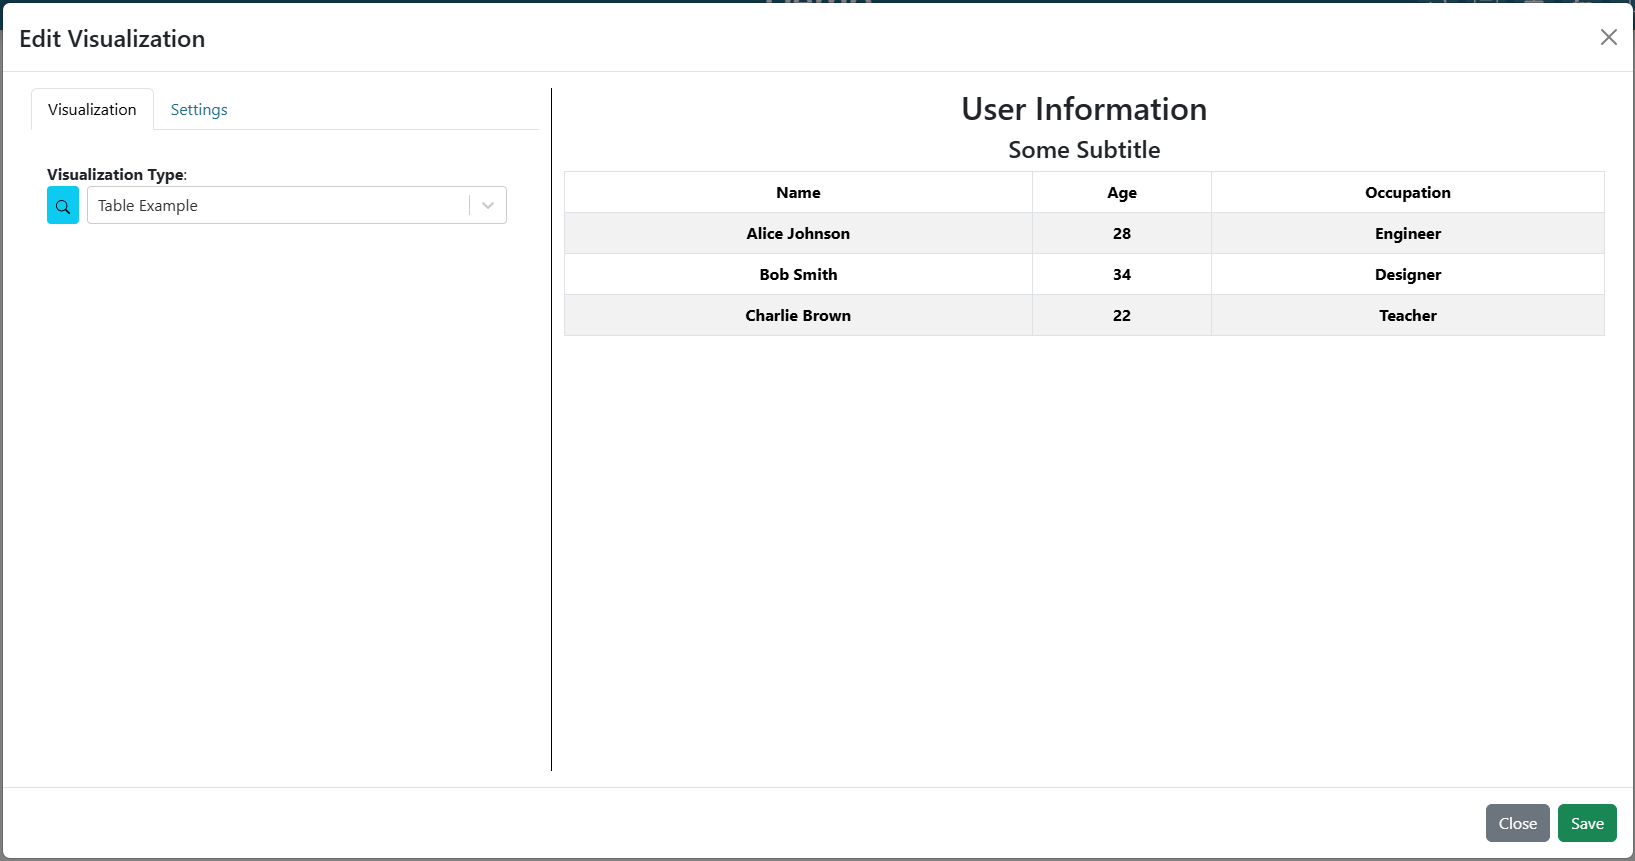
Table
Displays a table from the provided data.
visualization_type: table
- read return: (dictionary)
title (required): The title to display above the table
subtitle (optional): The subtitle to display above the table
data (required): A list of dictionaries containing keys/values for columns and rows respectively.
Example:
from tethysapp.tethysdash.plugin_helpers import TethysDashPlugin

class TableExample(TethysDashPlugin):
    name = "table_example"
    group = "Example"
    label = "Table Example"
    type = "table"
    tags = [
        "example",
        "table",
    ]
    description = "An example plugin for the table visualization"

    def run(self):
        """
            Return table data
        """

        data = [
            {
                "name": "Alice Johnson",
                "age": 28,
                "occupation": "Engineer",
            },
            {
                "name": "Bob Smith",
                "age": 34,
                "occupation": "Designer",
            },
            {
                "name": "Charlie Brown",
                "age": 22,
                "occupation": "Teacher",
            },
        ]
        title = "User Information"
        subtitle = "Some Subtitle"

        return {
            "title": title,
            "subtitle": subtitle,
            "data": data
        }
Image
Displays an image based on the returned URL string.
DataSource visualization_type value: image
- read return: (string)
A string containing the url to the image
Example:
from tethysapp.tethysdash.plugin_helpers import TethysDashPlugin


class ImageExample(TethysDashPlugin):
    name = "image_example"
    group = "Example"
    label = "Image Example"
    type = "image"
    tags = [
        "example",
        "image",
    ]
    description = "An example plugin for the image visualization"

    def run(self):
        """
        Return an image url
        """

        return "https://aquaveo.com/pub/media/wysiwyg/aquaveo-logo-bw.svg"
Image Collection
Displays a collection of images in a flex-wrap grid within a single visualization block.
DataSource visualization_type value: imageCollection
- read return: (dict)
urls (required): A list of strings containing the urls to the images
title (optional): A string title displayed above the image grid
columns (optional): An integer specifying the number of columns in the grid. If omitted, images flex automatically to fill the available space.
Example:
from tethysapp.tethysdash.plugin_helpers import TethysDashPlugin


class ImageCollectionExample(TethysDashPlugin):
    name = "image_collection_example"
    group = "Example"
    label = "Image Collection Example"
    type = "imageCollection"
    tags = [
        "example",
        "imageCollection",
    ]
    description = "An example plugin for the image collection visualization"

    def run(self):
        """
        Return a collection of image urls
        """

        return {
            "urls": [
                "https://example.com/image1.png",
                "https://example.com/image2.png",
                "https://example.com/image3.png",
            ],
            "title": "My Image Collection",
            "columns": 3,
        }
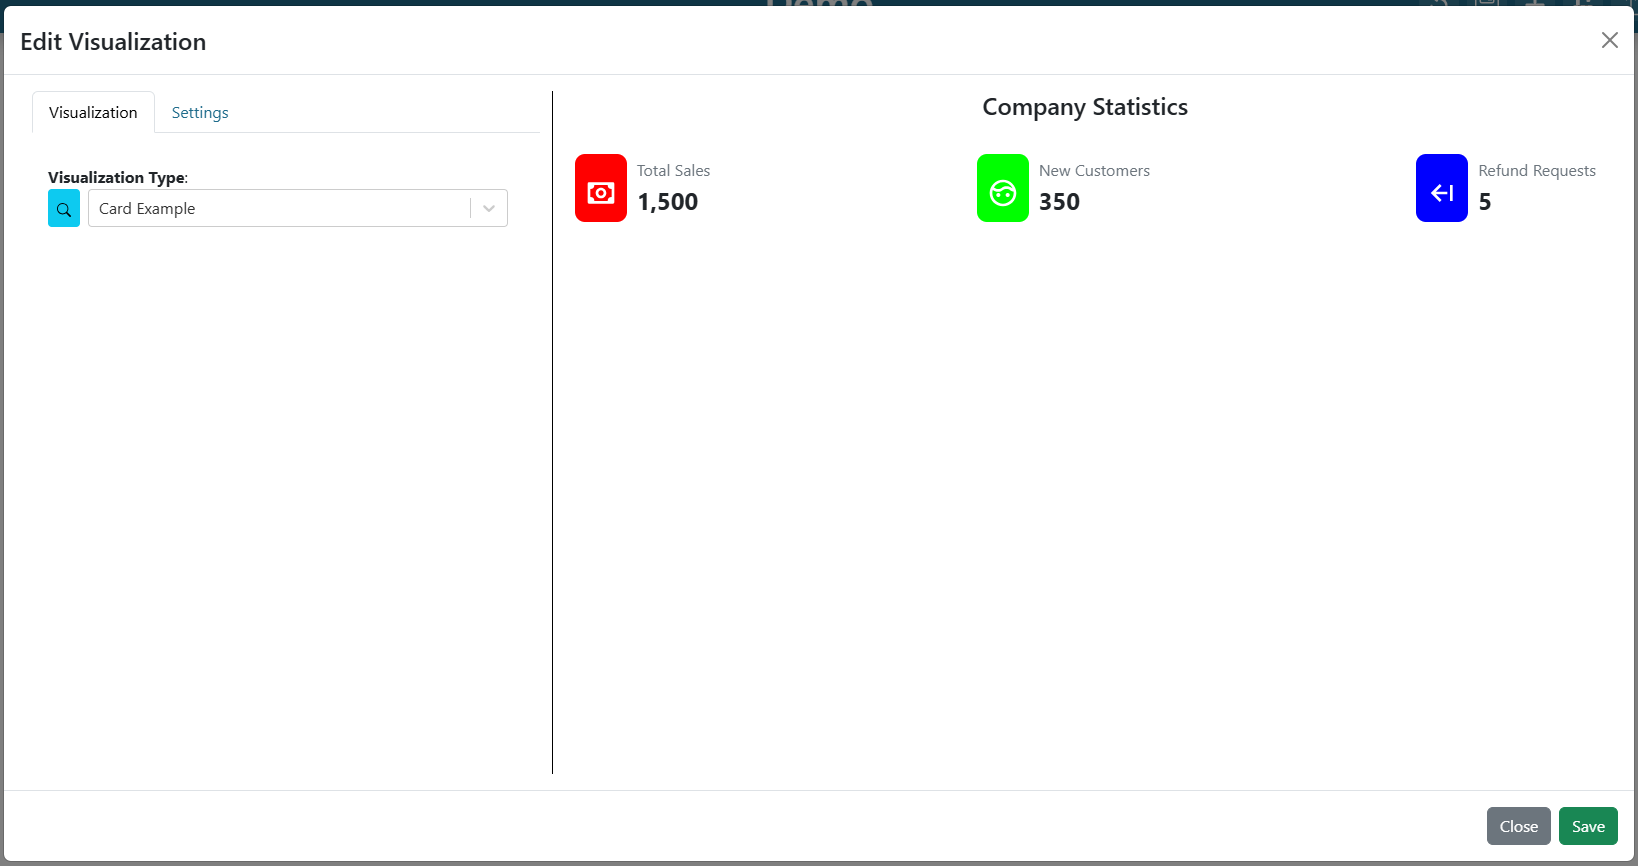
Card
Displays a list of information in a card based fashion where each element in the dictionary can have its own color, value, label, and icon.
DataSource visualization_type value: card
- read return: (dictionary)
title (required): The title to display above the cards
- data (required): A list of dictionaries containing the following keys.
color (Optional): hex or word based colors. Defaults to “black”
label (Optional): label for the card. Defaults to 0
value (Optional): value to display on the card. Defaults to “No Data Found”
icon (Optional): any React Icon BI icon
Example:
from tethysapp.tethysdash.plugin_helpers import TethysDashPlugin

class CardExample(TethysDashPlugin):
    name = "card_example"
    group = "Example"
    label = "Card Example"
    type = "card"
    tags = [
        "example",
        "card",
    ]
    description = "An example plugin for the card visualization"

    def run(self):
        """
            Return the data for the cards
        """

        data = [
            {
                'color': '#ff0000', # Background color for the icon (in hex format)
                'label': 'Total Sales', # Title or label for the statistic
                'value': '1,500', # Value of the statistic
                'icon': 'BiMoney' # Icon to display
            },
            {
                'color': '#00ff00',
                'label': 'New Customers',
                'value': '350',
                'icon': 'BiFace'
            },
            {
                'color': '#0000ff',
                'label': 'Refund Requests',
                'value': '5',
                'icon': 'BiArrowFromRight'
            },
        ]

        return {
            "title": "Company Statistics",
            "data": data
        }
Text
Displays custom text
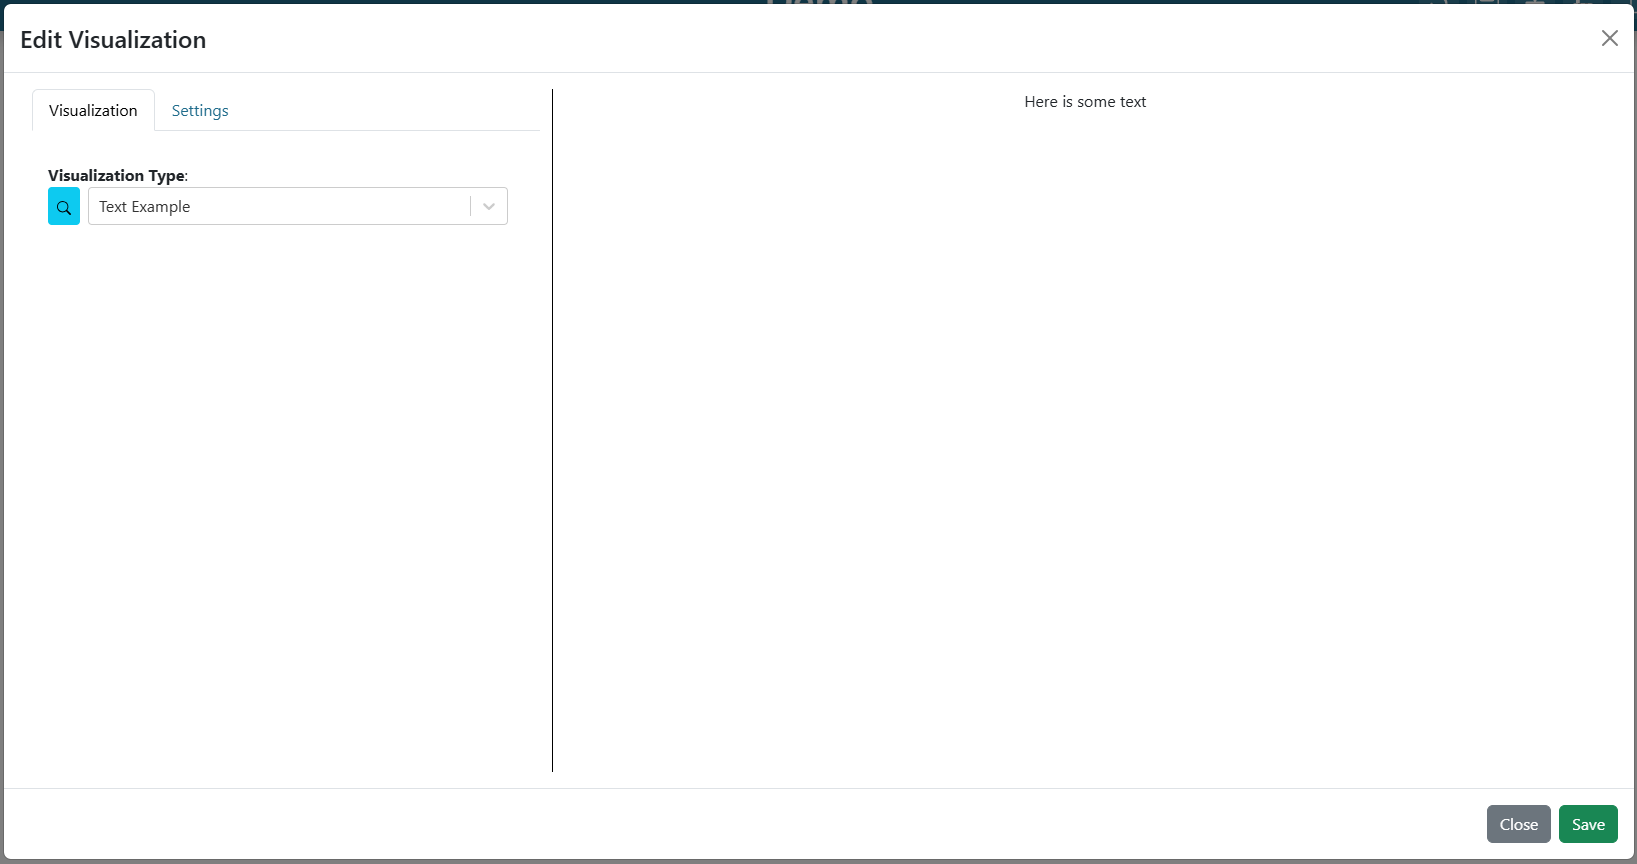
DataSource visualization_type value: text
- read return: (dictionary)
text (required): The text to show.
Example:
from tethysapp.tethysdash.plugin_helpers import TethysDashPlugin

class TextExample(TethysDashPlugin):
    name = "text_example"
    group = "Example"
    label = "Text Example"
    type = "text"
    tags = [
        "example",
        "text",
    ]
    description = "An example plugin for the text visualization"

    def run(self):
        """
            Return the data for the text
        """

        return {"text": "Here is some text"}
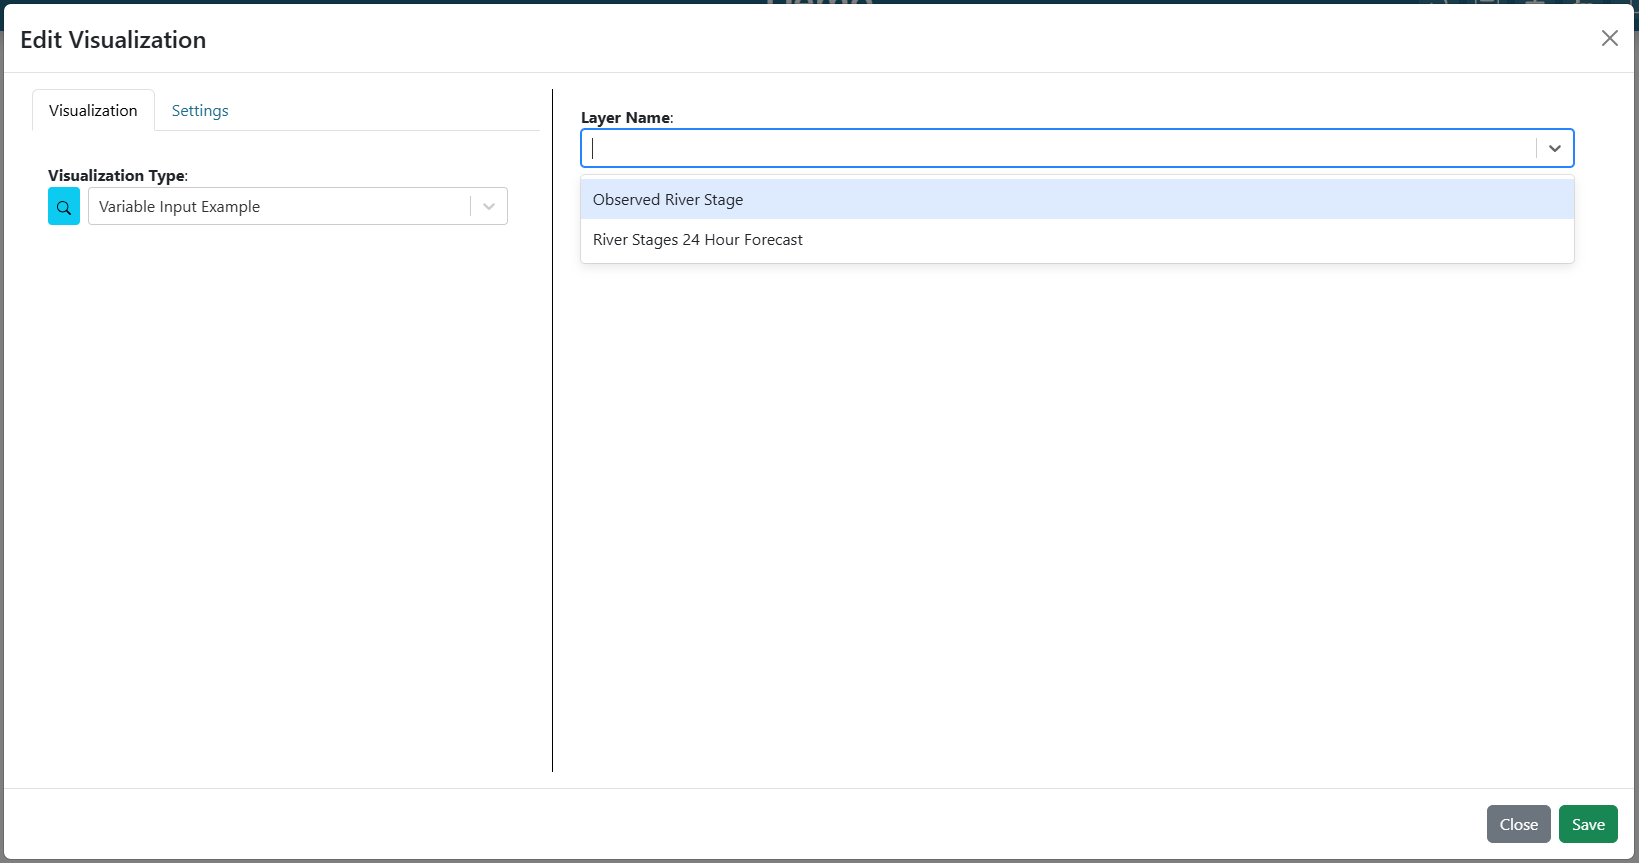
Variable Input
Displays a variable input that other visualizations can reference to dynamically update their behavior. See Variable Inputs for information on connecting variable inputs to visualizations.
DataSource visualization_type value: variable_input
- read return: (dictionary)
variable_name (required): Name of the variable input.
initial_value (required): Initial value of the variable input.
variable_options_source (required): Determines the input type. Can be
"text","number","checkbox","date","date-range","dropdown","slider","csv-uploader", or an array of{"label": str, "value": any}objects for a simple dropdown.metadata (optional): Configuration object for input types that require additional settings (date, date-range, dropdown, slider, csv-uploader).
Displays a text field with a refresh button.
from tethysapp.tethysdash.plugin_helpers import TethysDashPlugin

class TextVariableInput(TethysDashPlugin):
    name = "text_variable_input"
    group = "Example"
    label = "Text Variable Input"
    type = "variable_input"
    tags = ["example", "variable input"]
    description = "A text variable input"

    def run(self):
        return {
            "variable_name": "Search Term",
            "initial_value": "default text",
            "variable_options_source": "text",
        }
Displays a number field with a refresh button.
def run(self):
    return {
        "variable_name": "Year",
        "initial_value": 2024,
        "variable_options_source": "number",
    }
Displays a checkbox. The value updates immediately on toggle.
def run(self):
    return {
        "variable_name": "Show Legend",
        "initial_value": True,
        "variable_options_source": "checkbox",
    }
Displays a date picker. Optionally includes a time picker.
- metadata fields:
format (optional): Date format string using date-fns tokens (e.g.,
"MM/dd/yyyy","MM/dd/yyyy'T'HH:mm").showTimeInput (optional): Set to
Trueto show a time picker alongside the date. Defaults toTrue.
Note
In addition to picking a date, users can type relative date math
("now", "now-7D", "now+30D") or the preset latest directly
into the field. latest is shown with a “Latest” label and is passed to
consuming visualizations unparsed, so the plugin resolves it to the newest
available data. See Accessing Arguments in run() for how a plugin
consumes these values.
Date only example:
def run(self):
    return {
        "variable_name": "Forecast Date",
        "initial_value": "",
        "variable_options_source": "date",
        "metadata": {
            "format": "MM/dd/yyyy",
            "showTimeInput": False,
        },
    }
Date and time example:
def run(self):
    return {
        "variable_name": "Forecast Date",
        "initial_value": "",
        "variable_options_source": "date",
        "metadata": {
            "format": "MM/dd/yyyy'T'HH:mm",
            "showTimeInput": True,
        },
    }
Displays two linked date pickers for a start and end date. Each date becomes its own variable input that other visualizations can reference.
- metadata fields:
format (optional): Date format string using date-fns tokens. Defaults to
"MM/dd/yyyy'T'HH:mm".startDateVariable (required): Name for the start date variable input.
endDateVariable (required): Name for the end date variable input.
Note
The keys in initial_value must match the startDateVariable and endDateVariable names exactly.
Example:
def run(self):
    return {
        "variable_name": "Analysis Period",
        "initial_value": {
            "Start Date": "01/14/2026T00:00",
            "End Date": "01/16/2026T00:00",
        },
        "variable_options_source": "date-range",
        "metadata": {
            "format": "MM/dd/yyyy'T'HH:mm",
            "startDateVariable": "Start Date",
            "endDateVariable": "End Date",
        },
    }
Displays a dropdown selector. Users can also type to create new values.
- metadata fields:
choices (required): A list of
{"label": str, "value": any}objects.
Example:
def run(self):
    return {
        "variable_name": "Color Theme",
        "initial_value": "light",
        "variable_options_source": "dropdown",
        "metadata": {
            "choices": [
                {"label": "Light Mode", "value": "light"},
                {"label": "Dark Mode", "value": "dark"},
                {"label": "High Contrast", "value": "high_contrast"},
            ],
        },
    }
An alternative to the dropdown type above. Instead of using metadata, pass an array of option objects directly as the variable_options_source. No metadata is needed.
Example:
def run(self):
    layer_names = [
        {"label": "Observed River Stage", "value": 0},
        {"label": "River Stages 24 Hour Forecast", "value": 1},
    ]

    return {
        "variable_name": "Layer Name",
        "initial_value": "",
        "variable_options_source": layer_names,
    }
Displays a slider with optional play/pause animation controls. The slider supports three modes based on the dataType metadata field: Number, Date, and Array.
- Common metadata fields:
dataType (required):
"Number","Date", or"Array".outputFormat (optional): Format template for the displayed value. Use
"{{n}}"for numbers or date-fns tokens for dates.speedOptions (optional): A list of playback speeds in milliseconds (e.g.,
[2000, 1000, 500, 250, 100]).
Number Slider
Slides between a numeric min and max value.
- Additional metadata fields:
min (required): Minimum value.
max (required): Maximum value.
step (required): Step increment.
initialValue (required): Starting value. Use
initialRangeinstead for range mode.rangeMode (required):
Falsefor a single value,Truefor a two-handle range slider.initialRange (required if rangeMode is True): A two-element list
[low, high].Example:
def run(self):
    return {
        "variable_name": "Opacity",
        "initial_value": 50,
        "variable_options_source": "slider",
        "metadata": {
            "dataType": "Number",
            "min": 0,
            "max": 100,
            "step": 1,
            "initialValue": 50,
            "rangeMode": False,
            "outputFormat": "{{n}}%",
            "speedOptions": [2000, 1000, 500, 250, 100],
        },
    }
Date Slider
Slides between two dates using a configurable time delta.
- Additional metadata fields:
min (required): Start date string (e.g.,
"01/01/2020 12:00 AM"). Also supports relative dates like"now","now-7D","now+30D".max (required): End date string. Same format options as min.
step (required): Number of time delta units per step.
dateTimeDelta (required): Time unit for each step. One of
"Seconds","Minutes","Hours","Days","Weeks","Months","Years".initialValue (required): Starting date value.
rangeMode (required):
Falsefor a single value,Truefor a two-handle range slider.Example:
def run(self):
    return {
        "variable_name": "Forecast Time",
        "initial_value": "2020-01-05T00:00:00",
        "variable_options_source": "slider",
        "metadata": {
            "dataType": "Date",
            "min": "01/01/2020 12:00 AM",
            "max": "01/10/2020 12:00 AM",
            "step": 1,
            "dateTimeDelta": "Days",
            "initialValue": "2020-01-05T00:00:00",
            "rangeMode": False,
            "outputFormat": "MM/dd/yyyy",
            "speedOptions": [2000, 1000, 500, 250, 100],
        },
    }
Array Slider
Slides through a predefined list of discrete values.
- Additional metadata fields:
values (required): A list of values to slide through.
labels (optional): A list of display labels corresponding to each value.
initialValue (optional): Starting value (must be an item in the values list).
Example:
def run(self):
    return {
        "variable_name": "Radar Frame",
        "initial_value": "https://example.com/radar/frame1.png",
        "variable_options_source": "slider",
        "metadata": {
            "dataType": "Array",
            "values": [
                "https://example.com/radar/frame1.png",
                "https://example.com/radar/frame2.png",
                "https://example.com/radar/frame3.png",
            ],
            "labels": ["12:00", "12:15", "12:30"],
            "initialValue": "https://example.com/radar/frame1.png",
        },
    }
Displays a file upload area for CSV files. The uploaded data is parsed and made available as the variable value.
- metadata fields:
headers (required): A list of expected column names in the CSV file.
Example:
def run(self):
    return {
        "variable_name": "Upload Data",
        "initial_value": "",
        "variable_options_source": "csv-uploader",
        "metadata": {
            "headers": ["timestamp", "value", "location"],
        },
    }
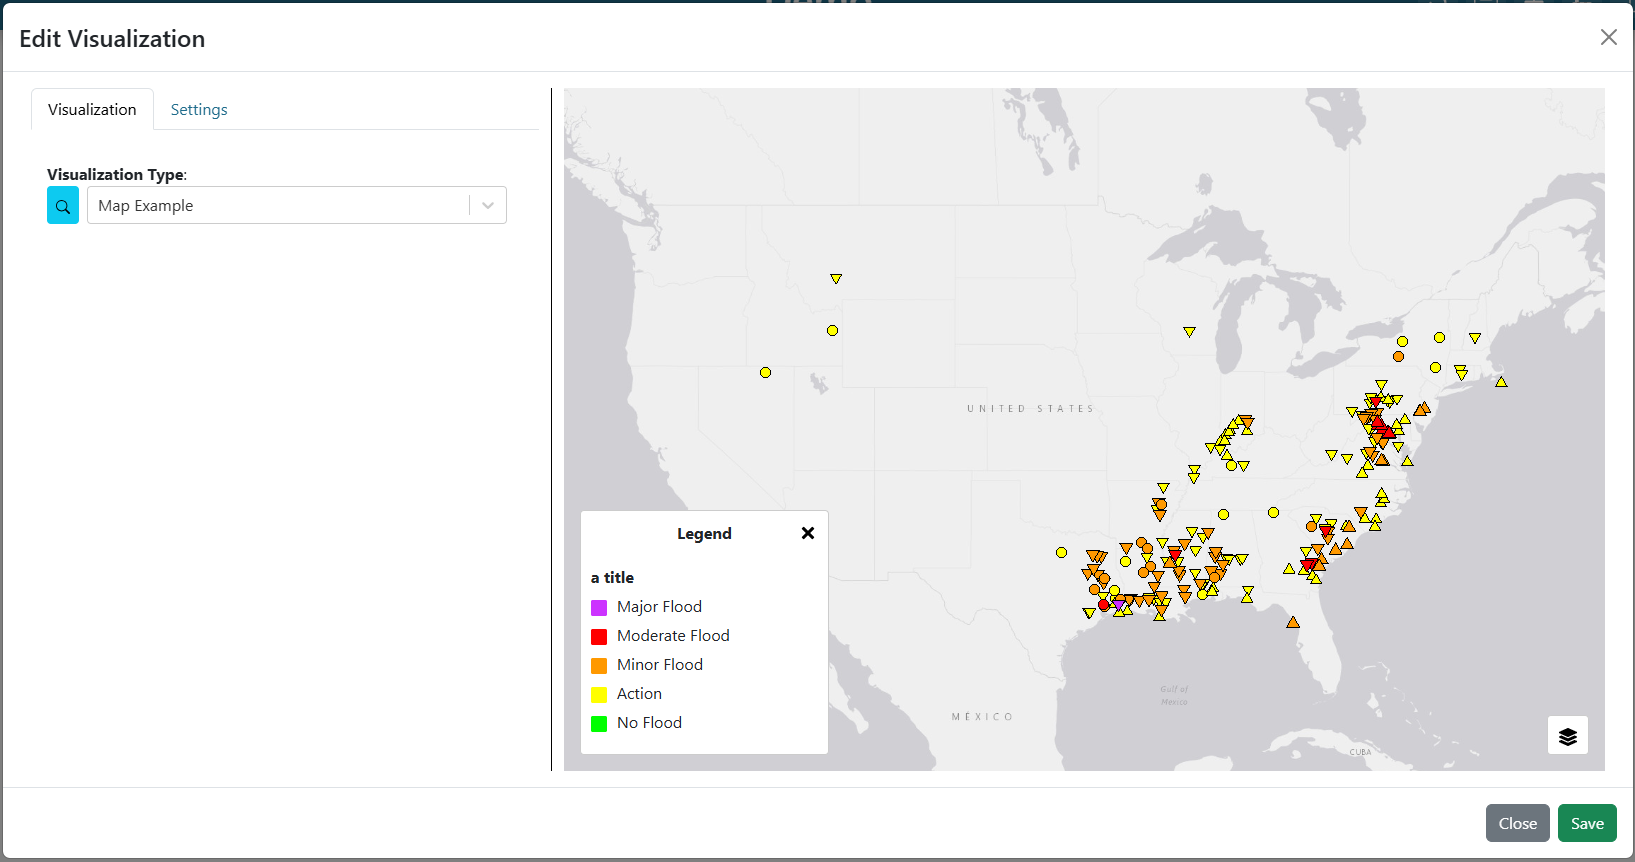
Map
Displays a map with the given layers and configuration. The map visualization is based on OpenLayers and follows similar configurations for configs and layers.
DataSource visualization_type value: map
- read return: (dictionary)
baseMap (required): string for ESRI BaseMap Layers
viewConfig (optional): Dictionary containing configurations for the map view. Check OpenLayers documentation for more information.
mapConfig (optional): Dictionary containing configurations for the map view div.
- layers (optional): A list of layers to include in the map. The following keys can be in each object in the array.
configuration (required): See maps Source Tab for more information.
attributeVariables (Optional): an object that maps a layers name (key) with the layers field and desired variable inputs to update the field value. See maps Attributes/Table Popup Tab for more information.
legend (required): an object that contains a title key and items key. The items key value is an array of object with label and color keys for the legend.
style (required): See maps Legend Tab for more information.
layerControl (optional): A boolean indicating if a layer control should be available.
Example:
from tethysapp.tethysdash.plugin_helpers import TethysDashPlugin


class Plots(TethysDashPlugin):
    group = "Example"
    label = "Map Example"
    type = "map"
    tags = [
        "example",
        "map",
    ]
    description = "An example plugin for the map visualization"


    def run(self):

        return {
            "baseMap": "https://server.arcgisonline.com/arcgis/rest/services/Canvas/World_Light_Gray_Base/MapServer",
            "layers": [
                {
                    "configuration": {
                        "type": "ImageLayer",
                        "props": {
                            "name": "asda",
                            "source": {
                                "type": "ESRI Image and Map Service",
                                "props": {
                                    "url": "https://maps.water.noaa.gov/server/rest/services/rfc/rfc_max_forecast/MapServer"
                                },
                            },
                        },
                    },
                    "attributeVariables": {
                        "Max Status - Forecast Trend": {"nws_lid": "Location"}
                    },
                    "legend": {
                        "title": "a title",
                        "items": [
                            {
                                "label": "Major Flood",
                                "color": "#cc33ff",
                            },
                            {
                                "label": "Moderate Flood",
                                "color": "#ff0000",
                            },
                            {
                                "label": "Minor Flood",
                                "color": "#ff9900",
                            },
                            {
                                "label": "Action",
                                "color": "#ffff00",
                            },
                            {
                                "label": "No Flood",
                                "color": "#00ff00",
                            }
                        ],
                    },
                },
            ],
            "layerControl": True,
        }
Map Layer
Used as templates for map layers. Users can select templates to fill out map layers options with preconfigured information from the plugin
DataSource visualization_type value: map_layer
Note
Use the LayerConfigurationBuilder helper class (shown in the example below) to construct the return dictionary. It validates required fields and ensures the correct structure is produced. Import it alongside TethysDashPlugin:
from tethysapp.tethysdash.plugin_helpers import TethysDashPlugin, LayerConfigurationBuilder
- read return: (dictionary)
- configuration (required): An object that contains metadata for the layer and source.
type (required): A string that determines the type of openlayers layer type (“ImageLayer”, “VectorLayer”, “TileLayer”, “VectorTileLayer”).
- props (required): An object that contains the layer properties.
name (required): A string that determines the name of the layer.
- source (required): An object that contains the metadata for the data source.
type (required): A string that determines the type of openlayers source type. See maps Source Tab for available options.
props (required): An object containing properties for the source. See maps Source Tab for available options and properties.
opacity (optional): Determines the transparency of the layer. Must be a number or float between 0 and 1.
minResolution (optional): The minimum resolution (inclusive) at which this layer will be visible.
maxResolution (optional): The maximum resolution (exclusive) below which this layer will be visible.
minZoom (optional): The minimum view zoom level (exclusive) above which this layer will be visible.
maxZoom (optional): The maximum view zoom level (inclusive) at which this layer will be visible.
minZoomQuery (optional): The minimum view zoom level (inclusive) at which this layer can be queried. If the mp is clicked beyond the zoom level, then the map will zoom into the minZoomQuery value.
clickTolerance (optional): Pixel tolerance for clicking and hovering features. For “ESRI Image and Map Service” sources this is the server identify tolerance (default 10); for “GeoJSON” and “ESRI Feature Service” sources it widens the on-screen hit area (default 0). Also sets the snap radius when snapToFeatures is enabled (default 15). See maps Feature Snapping and Click Tolerance for details.
snapToFeatures (optional): A boolean. When true, the cursor snaps to the nearest feature of this layer on hover and a click selects that feature directly. Supported for “ESRI Image and Map Service”, “GeoJSON”, and “ESRI Feature Service” sources. See maps Feature Snapping and Click Tolerance for details.
snapSublayer (optional): For “ESRI Image and Map Service” snap layers — the MapServer sublayer used to load snapping features. Defaults to the first id in the source’s LAYERS “show:N” parameter, else 0.
layerVisibility (optional): A boolean indicating the default visibility of the layer.
style (required): An object that contains the metadata for styling. See maps Style Tab for more information.
attributeVariables (optional): An object that maps a layers name (key) with a nested object for the layers field and desired variable input. See maps Attributes/Table Popup Tab for more information.
omittedPopupAttributes (optional): An object that maps a layers name (key) with an array of fields to omit in the popup. See maps Attributes/Table Popup Tab for more information.
attributeAliases (optional): An object that maps a layers name (key) with a nested object for the layers field and desired aliases. See maps Attributes/Table Popup Tab for more information.
tablePopupType (optional): One of
"none","click", or"hover". Governs whether and how the default attribute table popup opens for this layer. Defaults to"click"if omitted."none"suppresses only the table overlay popup — if a Custom Modal Popup is configured on the layer, it is still queried on click. See maps Attributes/Table Popup Tab for the full matrix.queryable (optional, legacy): A boolean. Kept for backward compatibility with dashboards saved before
tablePopupTypeexisted. Reads as"none"whenfalseand"click"otherwise. New plugins should prefertablePopupType.legend (optional): See maps Legend Tab for more information.
LayerConfigurationBuilder
TethysDash provides a
LayerConfigurationBuilderhelper class to construct map layer configurations with the correct structure. It is the recommended approach for building map layer plugins. The builder validates required source properties at build time and eliminates the need to manually construct the nested configuration dictionary.Supported source types:
ESRI Image and Map Service
ESRI Feature Service
WMS
KML
Image Tile
GeoJSON
Vector Tile
PMTiles Vector
PMTiles RasterBuilder methods:
set_source_properties(**kwargs)— Set properties on the layer’s data source (e.g.,url,params,attributions). Required and optional properties vary by source type; callget_available_source_properties()to inspect them.
set_layer_visibility(bool)— Set the default visibility of the layer.
set_opacity(float)— Set layer opacity between 0.0 and 1.0.
set_queryable(bool)— (legacy) MapsFalsetotablePopupType: "none"andTrueto the default ("click"). Kept for backward compatibility; new plugins should writetablePopupTypedirectly into the config (see the bullet above) when they need"hover"or want to make the field explicit.
set_min_zoom(int)/set_max_zoom(int)— Set zoom visibility bounds.
set_min_resolution(int)/set_max_resolution(int)— Set resolution visibility bounds.
set_min_zoom_query(int)— Minimum zoom level required to query the layer.
set_click_tolerance(int)— Pixel tolerance for clicking/hovering features; doubles as the snap radius when snapping is enabled. See maps Feature Snapping and Click Tolerance.
set_snap_to_features(bool)— Snap the cursor to the layer’s nearest feature on hover and select it on click. See maps Feature Snapping and Click Tolerance.
set_snap_sublayer(int)— MapServer sublayer used to load snapping features (ESRI Image and Map Service sources only).
set_geojson(dict)— Attach a GeoJSON object (for GeoJSON source type only).
set_plugin_source(source, args)— Mark the layer as a dynamicmap_layerand bind it to a plugin that will be invoked at render time viafetch_features(). GeoJSON source only. See Dynamic map_layer plugins.
set_legend(dict | "default" | None)— Set the legend configuration.
set_style(dict | str)— Set the layer style.
add_attribute_alias(key, alias, layer_name)— Add a display alias for a layer attribute.
add_attribute_variable(key, variable, layer_name)— Map a layer attribute to a dashboard variable input.
omit_popup_attribute(key, layer_name)— Hide an attribute from the feature popup.
get_available_source_properties()— Return the required and optional properties for the configured source type.
get_layer_names()— Fetch layer names from the service (supported for ESRI, WMS, and GeoJSON sources).
get_layer_attributes()— Fetch attribute field names from the service.
build()— Validate required fields and return the final configuration dictionary.
Example:
from tethysapp.tethysdash.plugin_helpers import TethysDashPlugin, LayerConfigurationBuilder


class MapLayerExample(TethysDashPlugin):
    name = "map_example"
    group = "Example"
    label = "Map Layer Template Example"
    type = "map_layer"
    tags = ["example", "map", "map_layer"]
    description = "An example plugin for the map layer template"

    def run(self):
        """
        Return map layer configuration using LayerConfigurationBuilder
        """
        layer_name = "RFC Max Forecast"
        sublayer_name = "Max Status - Forecast Trend"

        builder = LayerConfigurationBuilder(layer_name, "ESRI Image and Map Service")

        builder.set_source_properties(
            url="https://maps.water.noaa.gov/server/rest/services/rfc/rfc_max_forecast/MapServer",
            attributions="National Water Center",
            params={"LAYERS": "show:0"},
        )

        builder.set_layer_visibility(True)
        builder.set_opacity(0.5)
        builder.set_queryable(True)

        builder.add_attribute_alias("record_threshold", "Record Threshold", sublayer_name)
        builder.add_attribute_alias("major_threshold", "Major Threshold", sublayer_name)
        builder.add_attribute_alias("moderate_threshold", "Moderate Threshold", sublayer_name)
        builder.add_attribute_alias("minor_threshold", "Minor Threshold", sublayer_name)
        builder.add_attribute_alias("action_threshold", "Action Threshold", sublayer_name)

        builder.add_attribute_variable("nws_lid", "LID", sublayer_name)

        builder.omit_popup_attribute("geom", sublayer_name)
        builder.omit_popup_attribute("oid", sublayer_name)

        builder.set_legend({
            "title": "Some Title",
            "items": [{"label": "Some label", "color": "green", "symbol": "square"}],
        })

        return builder.build()
Dynamic map_layer plugins
By default, map_layer plugins run once at configure time (from the Add
Layer modal): their run() output fills the Source/Style/Legend/Attributes
tabs and is then frozen into the saved dashboard. A plugin may opt into
runtime behavior so that its feature payload is also re-fetched when the
map is viewed and when bound variable inputs change, without re-running any
of the configure-time panes.
To opt in, set dynamic_map_layer = True on the plugin class and
implement a second method fetch_features() that returns a GeoJSON
FeatureCollection. Both conditions are required — the framework raises at
initialization if dynamic_map_layer = True without a fetch_features
override, and warns if fetch_features is overridden without the flag
(the method would never be invoked):
from tethysapp.tethysdash.plugin_helpers import (
    TethysDashPlugin,
    LayerConfigurationBuilder,
)
from your_package import compute_hotspots


class HotspotLayer(TethysDashPlugin):
    name = "hotspots"
    group = "Example"
    label = "Dynamic Hotspots"
    type = "map_layer"
    dynamic_map_layer = True
    args = {"bbox": "text", "threshold": "number"}
    tags = ["example", "map_layer", "dynamic"]
    description = "Re-fetches hotspot features when bound variable inputs change."

    def run(self):
        """Configure-time scaffold: style, legend, attribute metadata."""
        builder = LayerConfigurationBuilder("Hotspots", "GeoJSON")
        builder.set_plugin_source("hotspots", self.args)
        builder.set_legend(
            {
                "title": "Intensity",
                "items": [
                    {"label": "High", "color": "#cc0000", "symbol": "circle"},
                    {"label": "Low", "color": "#ffcc00", "symbol": "circle"},
                ],
            }
        )
        return builder.build()

    def fetch_features(self):
        """Runtime features: invoked on load and on variable-input change."""
        self.send_update("Computing hotspots...", percentage_complete=10)
        features = compute_hotspots(self.bbox, self.threshold)
        self.send_update("Done", percentage_complete=100)
        return {
            "type": "FeatureCollection",
            "features": features,
            "crs": {
                "type": "name",
                "properties": {"name": "EPSG:4326"},
            },
        }
Return contract for fetch_features
The method MUST return a dict with:
type: must be"FeatureCollection"features: a list (may be empty — zero features is a valid success state)crs: a CRS block withproperties.nameset to a valid EPSG identifier (TethysDash convention; seevalidate_geojson()).
The runtime validator (validate_feature_collection()) rejects:
Nonereturns — treat “nothing to draw right now” by returning an emptyFeatureCollectioninstead.Configure-time scaffold shapes — a return whose top-level dict contains any of
style,legend,source,props, orconfiguration. This catches the common mistake of returning the whole scaffold fromfetch_featuresinstead of only theFeatureCollection.
Interaction model
Runtime plugins are GeoJSON-only in v1.
LayerConfigurationBuilder.set_plugin_sourcerequireslayer_source="GeoJSON".Style, legend, and attribute metadata are snapshot at save time — the author’s edits are never silently overwritten by plugin updates. Authors can explicitly click “Reset to plugin defaults” in the Add Layer modal to pick up new defaults on demand.
At render time, only features refresh. The backing OpenLayers
VectorLayeris preserved in place (source.clear() + addFeatures()), so popup and highlight state survive updates.Re-fetches on variable-input change are debounced and the older in-flight request is cancelled when a new one starts. Cancellation is best-effort at the transport layer: the backend plugin execution may run to completion even after the frontend has discarded the result. Design
fetch_featuresto be idempotent and side-effect-safe, or defer side-effects until after a successful return.Progress streamed via
self.send_update(message, percentage_complete=...)is automatically routed to the correct layer’s per-layer indicator — no extra argument needed; the framework attaches the layer id from the request context.
Plugin subclasses that override send_update
If a plugin subclass wraps send_update (for logging, metrics, etc.),
accept and forward keyword arguments so the new layer_id kwarg flows
through:
class MyPlugin(TethysDashPlugin):
    def send_update(self, message, percentage_complete=None, **kwargs):
        logger.info(f"progress: {message}")
        super().send_update(
            message, percentage_complete=percentage_complete, **kwargs
        )
Known limitation: plugin arg-schema drift
When a plugin’s arg schema changes between save and viewer time (e.g., a
renamed or removed arg), a plugin that absorbs unknown arguments via
**kwargs can silently succeed with stale args. TethysDash does not detect
this automatically in v1. Treat plugin arg/default changes as breaking changes
and communicate them to dashboard authors.
Custom Visualization
Displays a custom visualization from a custom react component.
Custom React Component
In order to use a custom react component, the custom react component must follow the Module Federation setup from webpack. An example of a functioning custom component for tethysdash can be found in the tethysdash_custom_visualization_example repository. The following files/configurations are needed to implement a custom component and come from the mentioned repository.
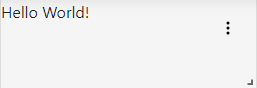
Create the Component
The first step in implementing a custom react component is to create it. Visit the React website to learn more about react and react components.
Below is an example of a simple react component that renders a Hello World! div. This component comes from the example repo, and resides in src/App.js file.
1import React, { memo } from "react";
2
3const CustomComponent = () => {
4    return <div>Hello World!</div>;
5};
6
7export default memo(CustomComponent);
webpack.config.js
Custom components must be exposed in the webpack configuration. In the example below on line 38, the CustomComponent (object key) is being exposed from the ./src/App path (object value). Multiple components can be exposed by adding to the exposes object.
The name of the module federation plugin in line 35 can also be upated and customized. This value will be used in the python plugin as the mfe_scope value.
32. . .
33plugins: [
34    new ModuleFederationPlugin({
35        name: "custom_component_scope",
36        filename: "remoteEntry.js",
37        exposes: {
38            "./CustomComponent": "./src/App", // Adjusted path to exposed module
39        },
40...
Testing
In order to test that the created custom component is working as expected, some additional changes have to be made to some files for the custom component to render in a browser. The following information is based on the example repo and may be different than other setups.
index.js
When running a local webpack server for component verification, the desired component needs to be referenced. If using the example repo, the src.index.js is what will be ran from webpack.
As in the example below, ensure that the custom component is being imported and then rendered.
1import React from "react";
2import ReactDOM from "react-dom/client";
3import CustomComponent from "./App";
4import "./index.css";
5
6const root = ReactDOM.createRoot(document.getElementById("root"));
7
8root.render(<CustomComponent />);
Running local webpack server
After ensuring that the custom component will be rendered, run a local webpack server by doing the following:
Open a terminal
cd into the folder with the code
run
npm installto install npm dependencies from the package.json filerun
npm startto start webpack server.Check the logs to find the locally hosted server and go to it. If using the example repo, this will be http://localhost:3000/
Publishing
Once the package is ready to use, it must be built and published to npm with the following:
Open a terminal
cd into the folder with the code
run
npm run buildrun
npm publishWarning
Make sure to update the package.json file as needed, including the name of the package and the necessary dependencies.
Custom Python Component
DataSource visualization_type value: custom
read return: (dictionary)
url (required): The url of the custom react component remoteEntry file. If using a published package, this is the url to the remoteEntry.js file from the unpkg url (i.e. https://unpkg.com/mfe-ol@latest/dist/remoteEntry.js). If testing locally, this is the url to the remoteEntry.js file from the locally host server (i.e. http://localhost:3000/remoteEntry.js)
scope (required): The name of the ModuleFederationPlugin found in the webpack.config.js file.
module (required): The react component that will be used. The value must match the keys found in the exposes property of the ModuleFederationPlugin (i.e. “./CustomComponent”).
props (optional): A dictionary containing any necessary properties or arguments for the custom component.
Example:
from tethysapp.tethysdash.plugin_helpers import TethysDashPlugin

class CustomExample(TethysDashPlugin):
    name = "custom_example"
    group = "Example"
    label = "Custom Example"
    type = "custom"

    def run(self):
        """
            Return the configuration for the custom component
        """
        mfe_unpkg_url = "http://localhost:3000/remoteEntry.js"
        # mfe_unpkg_url = "https://unpkg.com/mfe-ol@latest/dist/remoteEntry.js"
        mfe_scope = "custom_component_scope"
        mfe_module = "./CustomComponent"

        return {
            "url": mfe_unpkg_url,
            "scope": mfe_scope,
            "module": mfe_module,
        }
Testing
To test your plugin, run Python in a terminal or Jupyter notebook, initialize your class, and call the read method. You can configure different arguments and scenarios to test your workflows.
Installation
Once your plugin is ready, create a setup file so it can be installed and used by the dashboard app. If using setup.py, add the entry_points argument as shown below. For multiple data sources, add each to the intake.drivers list as needed.:
setup(
    ...
    entry_points={
        'intake.drivers': [
            '<plugin_name> = <path_to_plugin_source>:<data_source_name>',
        ]
    },
    ...
)
If using pyproject.toml, add the entry_points as shown below:
[project.entry-points."intake.drivers"]
<plugin_name> = "<path_to_plugin_source>:<data_source_name>"
automatically be added to the intake registry for use. Replace the inserted values above with the necessary strings (i.e. ‘usace_time_series = usace_visualizations.time_series:TimeSeries’).
The entry point tells intake that your package is a driver. When installed, the plugin is automatically added to the intake registry. Replace the example values with your own (e.g., ‘usace_time_series = usace_visualizations.time_series:TimeSeries’).
Sending Progress Updates
TethysDash plugins can send progress updates to the dashboard app during long-running processes, providing users with real-time feedback. This is easily accomplished using the send_update method provided by the TethysDashPlugin base class. Your TethysDash application must be configured to use websockets. For more information about setting up websockets, see Installation and Setup.
In your plugin class, simply call self.send_update from within a class method. The send_update method automatically handles the WebSocket message for you. For example:
from tethysapp.tethysdash.plugin_helpers import TethysDashPlugin

class MyLongRunningPlugin(TethysDashPlugin):
    name = "long_plugin"
    group = "Example"
    label = "Long Running Example"
    type = "plotly"
    args = {}
    tags = ["example"]
    description = "Shows progress updates."

    def run(self):
        # Step 1
        self.send_update("Starting step 1...")
        # ... do some work ...
        self.send_update("Step 1 complete", percentage_complete=33)
        # Step 2
        self.send_update("Starting step 2...")
        # ... do more work ...
        self.send_update("Step 2 complete", percentage_complete=66)
        # Final step
        self.send_update("All steps complete!", percentage_complete=100)
        return {"result": "done"}
The percentage_complete argument is optional and can be used to indicate progress as a percentage (0–100). You can call send_update as many times as needed during your process.
This approach is recommended for all new plugins. If you are maintaining legacy plugins that do not subclass TethysDashPlugin, you may still use send_websocket_message directly, but new development should use send_update for clarity and maintainability.