Configuring Visualizations
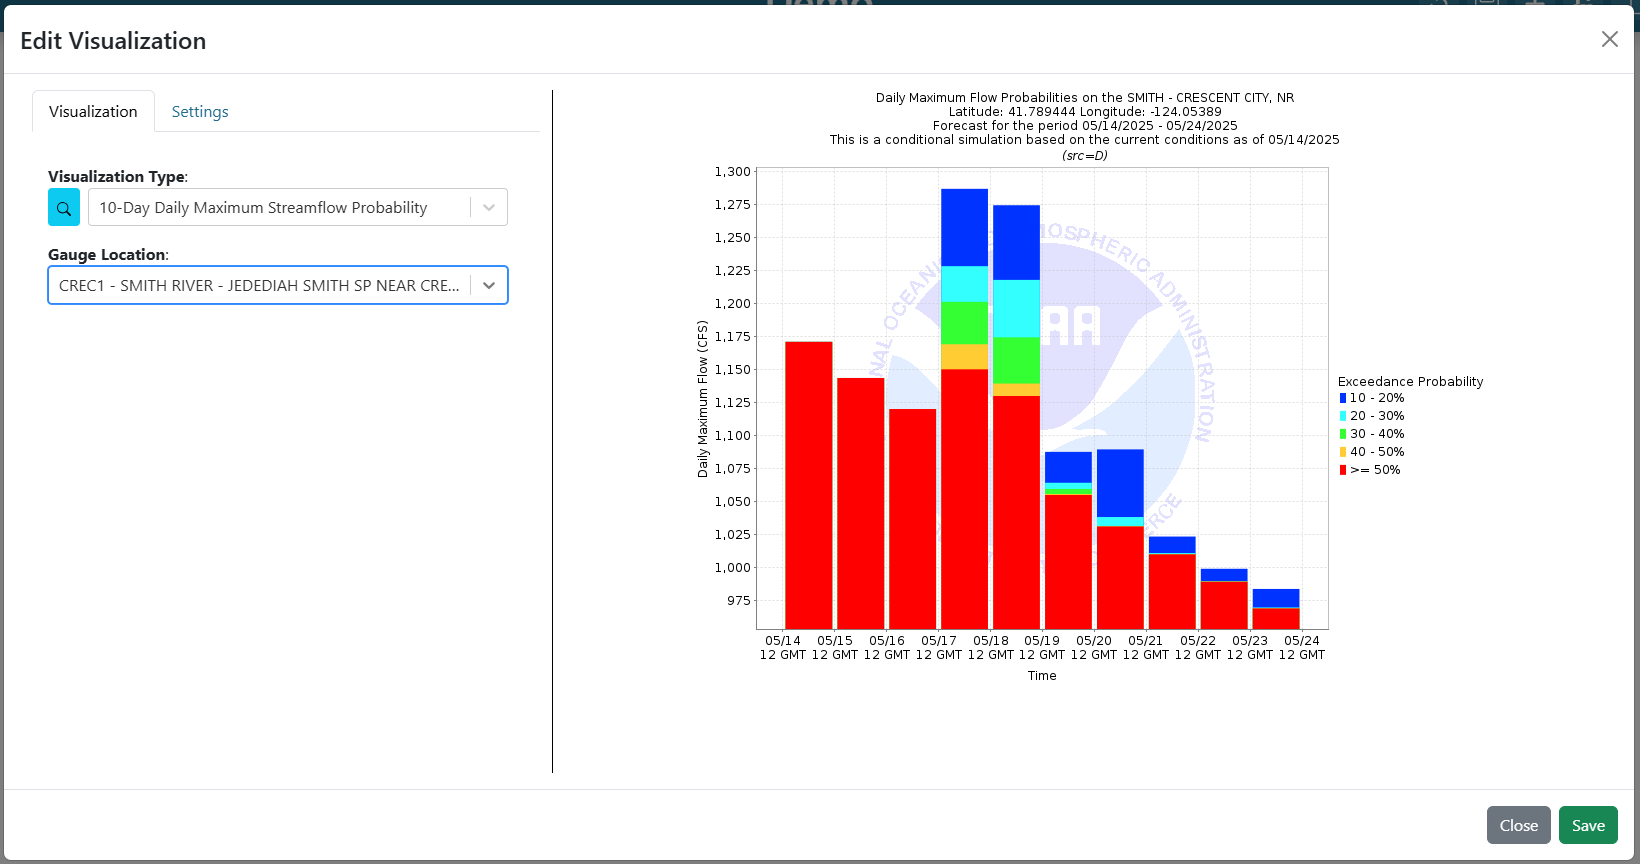
Each dashboard item is a visualization that can be configured and customized. To edit a visualization, open the item’s context menu and select “Edit.” A popup appears with configuration options on the left and a live preview on the right.
Visualization Tab
Select the type of visualization from a dropdown or use the search (
 ) button.
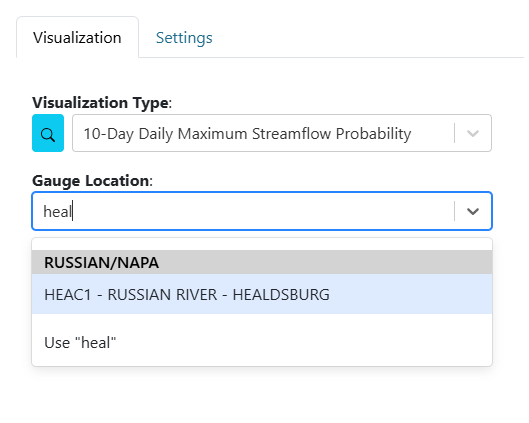
Hover over visualization cards to see descriptions, tags, and types.
Type in dropdowns to filter options or add new ones.
After selecting a visualization type, additional arguments may appear, specific to that visualization. For example, a chart may require you to select a location.
Most visualizations are custom, based on installed plugins. For more information, see the Visualization Plugins section.
Default Visualization Types
Map: Add a map with configurable basemaps, layers, extent, and drawing tools.
Custom Image: Display a publicly accessible image.
Text: Display formatted text.
Variable Input: Create a variable for use in other visualizations. See Variable Inputs for details.
Live Chat: Display a chat box for users to communicate in real time. Websocket must be configured for this visualization to work. See Installation and Setup for details.
Settings Tab
Refresh Rate: How often the visualization updates automatically (0 = no auto-refresh).
Border: Style all or individual borders.
Background Color: Set the background color and opacity.
Box Shadow: Add a box shadow using border colors.
Show Attribution: Display an attribution icon if available.
Custom Messaging: Set custom error or empty-value messages.
Tip
Settings may vary by visualization type. See the visualization’s options for details.