Create a Map
To create a map in the dashboard, add or edit a dashboard item (Editing Dashboards).
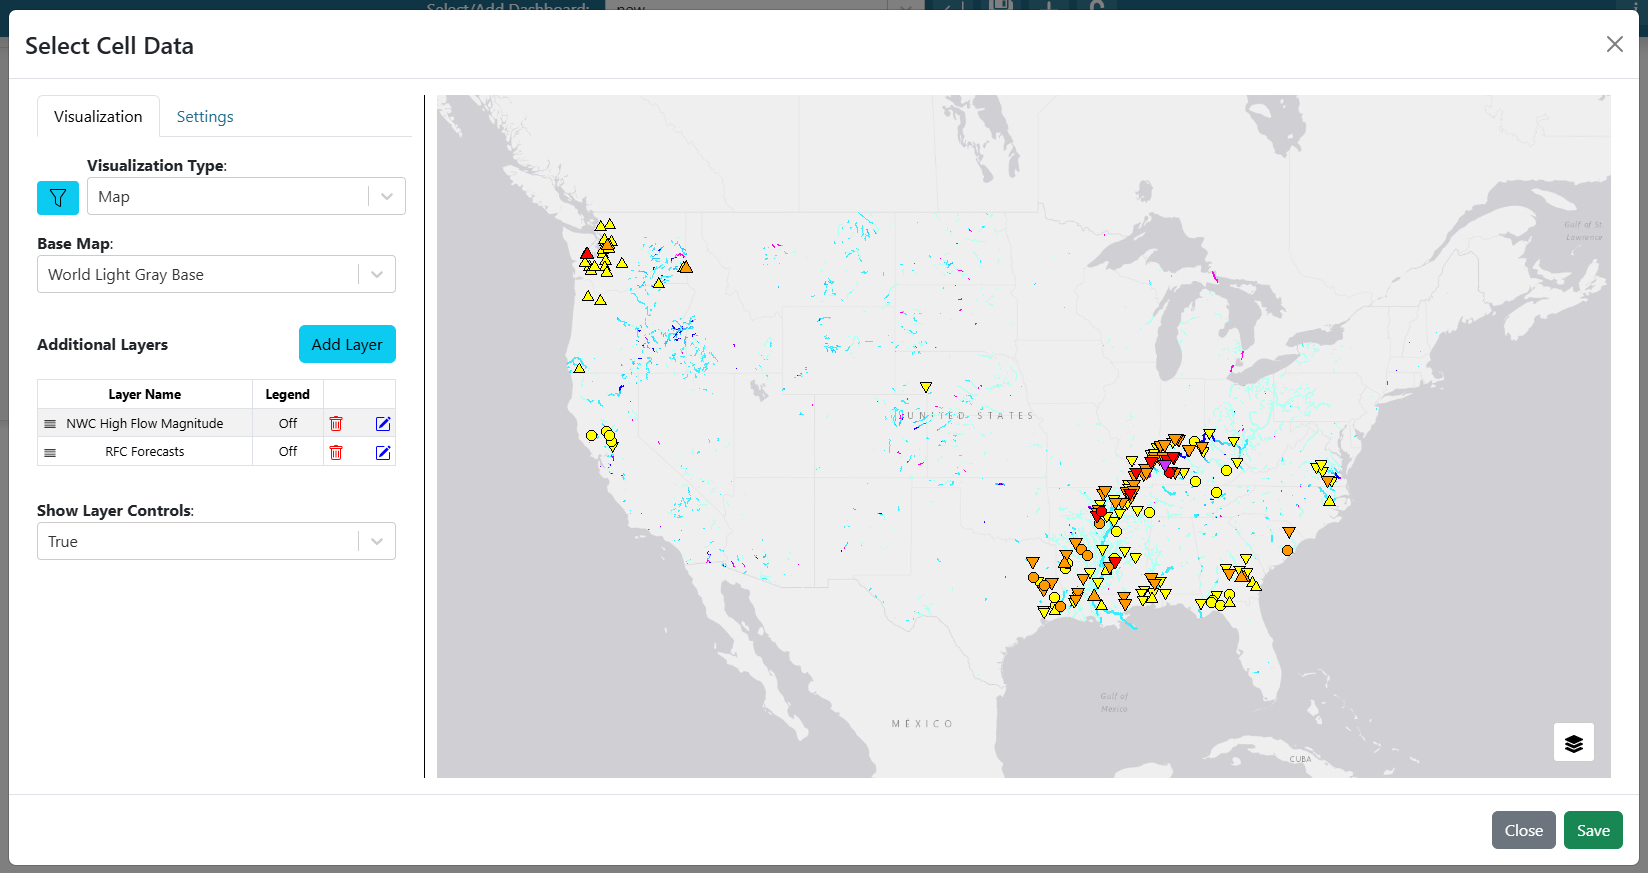
In the visualization editor, open the Visualization Type dropdown and select Map.
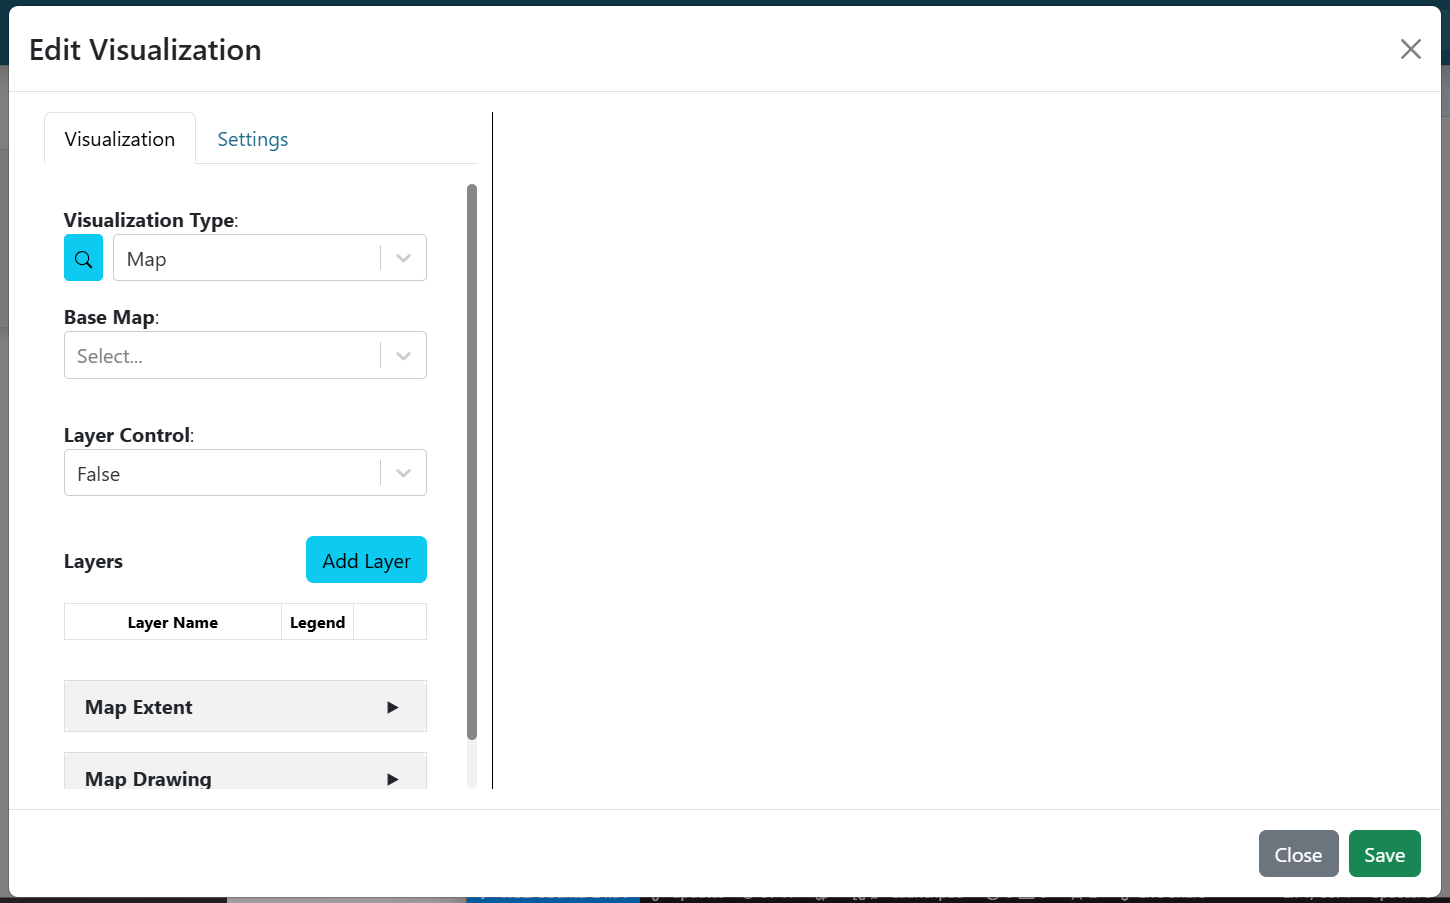
The following options are available to configure the map:
Base Map
A list of available basemaps for the map.
Layer Controls
Determines whether a layer control panel is shown, allowing users to toggle layer visibility.
Layers
A table summarizes the configured layers for the map. To add a new layer, click “Add Layer” and complete the necessary configurations. Once saved, layers appear in the table, where they can also be deleted or edited. See the Configure a Map Layer section for more details.
You can also reorder layers in this table to change their rendering order.
Map Extent
Choose either “Use the Previewed Map Extent” (the map zooms to the current view) or “Use a Custom Extent” (enter minimum and maximum latitude/longitude values and optionally an extent variable name).
Map Drawing
Map drawing lets you add features directly to the map:
Drawn Feature Limit: Maximum number of items that can be drawn.
Allowed Types: Select which shapes can be drawn: Point, LineString, Polygon, Rectangle.
Variable Name: Save drawings under a variable name for use in other visualizations.